
Figure 10.
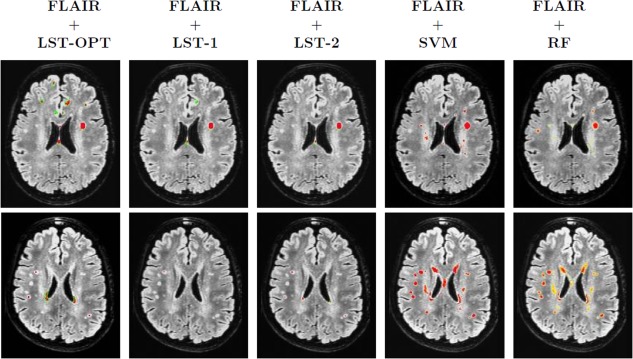
Sensitivity of LST outputs to k. Each row corresponds to one subject. First three columns are the LST outputs at different ks (optimal k chosen by toolbox followed by k = 0.1 and k = 0.2, respectively). Last two columns correspond to the outputs of SVM and RF, respectively. Underlays are coregistered and bias corrected FLAIR images and the color map of overlays range from blue (0) to red (1). [Color figure can be viewed in the online issue, which is available at http://wileyonlinelibrary.com.]