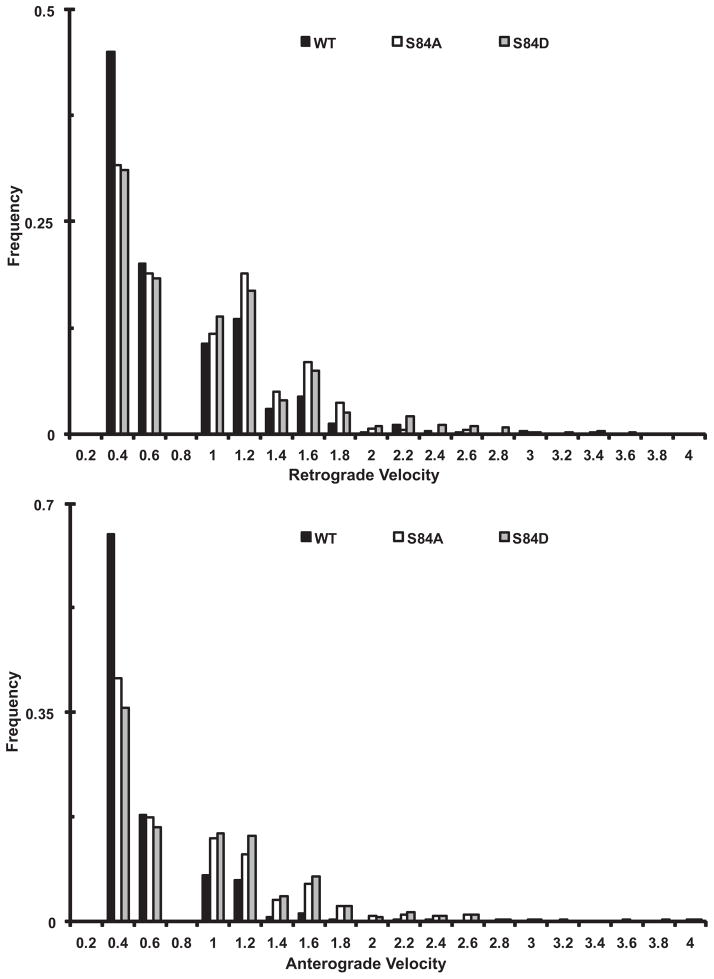
Figure 5. Comparison of the velocity distributions of dynein puncta containing wild type and mutant IC-2C isoforms in axons.
Cytoplasmic dynein IC-2C isoforms were transfected into neurons and the fluorescent dynein was imaged as for Figure 2. The movements of individual puncta between each frame were tracked manually and analyzed with MetaMorph.
A. Comparison of the retrograde interval velocity distributions of the IC-2C WT and mutant isoforms in axons. Velocities (μm/s) of individual retrograde movements of GFP-IC-2C dynein puncta between two frames were plotted against the frequency of their occurrence; black, IC-2C WT dynein (n=684); white IC-2C S84A (n=780), and gray IC-2C S84D dynein puncta (n=1030).
B) Comparison of the anterograde interval velocity distributions of the IC-2C WT and mutant isoforms in axons/neurons. Velocities (μm/s) of individual anterograde movements of GFP-IC-2C dynein puncta between two frames were plotted against the frequency of their occurrence; black IC-2C WT (n=1074), white IC-2C S84A (n=1172), and gray IC-2C S84D dynein puncta (n=987).

