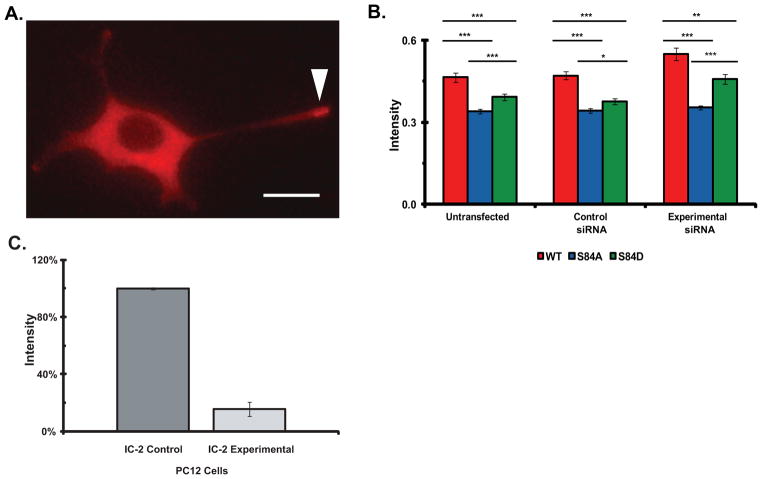
Figure 6. Mutations of IC-2C at S84 modulate dynein motility.
Three PC12 cell lines with the stable expression of mRFP IC-2C WT, and the IC-2C S84A and IC-2C S84D mutations were generated. The cells were differentiated by the addition of NGF and 3–4 days later the cells and the growth cones of neurite processes of the differentiated cells were imaged.
A. Dynein distribution in differentiated PC12 cells. Representative image of mRFP IC-2C WT in differentiated PC12 cell showing dynein accumulation in a growth cone of a long process marked with arrowhead, see also Figure 3 in (Myers et al. 2007). The scale bar is 10 μm.
B. Mutation of IC-2C S84 changes dynein motility and reduces the accumulation of dynein in growth cone. The fluorescence intensity the mRFP-IC-2C in the three cell lines with stable expression of the tagged IC isoforms per unit growth cone area was measured and corrected for differences in IC-mRFP expression in the different cell bodies; red IC-2C WT, blue IC-2C S84A, and green IC-2C S84D. The IC isoform intensities were measured under three experimental conditions; Untransfected, the three parent cells lines with stable expression of the indicated IC isoform (left set of bars), Control siRNA, the parent cell lines transfected with the control siRNA reagent (middle set of bars), and Experimental siRNA, the cell lines transfected with an IC-2 siRNA reagent to reduce the expression of the endogenous IC-2 (right set of bars). There were significant differences between the fluorescent intensities which measure the accumulation of dynein in growth cones between the IC-2C WT and both mutant cell lines under all three experimental conditions. Significant differences were also observed when the dynein accumulations in cell expressing the S84A & S84D mutations were compared. (Student’s t-test * p < 0.05, ** p < 0.002, and *** P < 0.001). Untrasfected cell lines; IC-2C WT n=84, S84A n=184, S84D n=125. Control siRNA; IC-2C WT n=112, S84A n=169, S84D n=130. Experimental siRNA; IC-2C WT n=119, S84A, n=170, S84D n=47.
C. Quantitation of effect of siRNA in reducing the expression level of IC-2 isoforms in PC12 cells. PC12 cells were transfected with siRNA oligonucleotides as described in the Methods and (Ha et al. 2008). After 4 days the cells were lysed and polypeptides resolved by SDS-PAGE and Western blotting. The blots were probed with the 74.1 antibody and the intensities of the bands corresponding to the endogenous IC-2 were quantified using MetaMorph. The intensities of the bands for cells transfected with control scrambled oligonucleotides and experimental siRNA oligonucleotides are graphed (n=3). An ~85% reduction in the expression of endogenous IC-2 was achieved.

