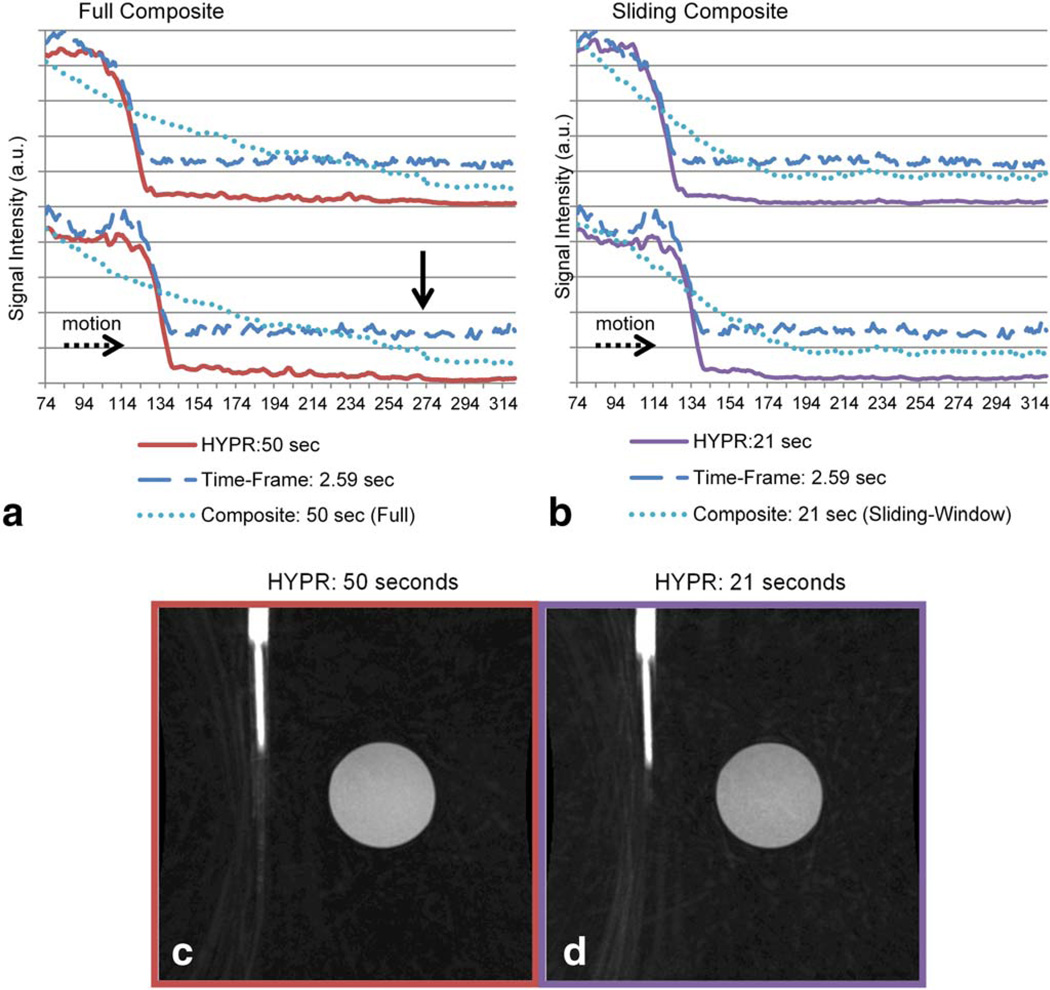
FIG. 7.
Leading edge profiles measured in the direction of motion from HYPR images reconstructed with composite image temporal lengths of 50 and 21 s. The times reported in the legend entry represent the longest temporal duration used in the given reconstruction process for each entry. Composite:50 sec corresponds to a full composite, while Composite:21 sec corresponds to a sliding window composite. Uncropped, single slice images from HYPR data-sets reconstructed using a full composite (c) and a sliding window composite (d) are shown. Note the increased amount of undersampling artifacts present in (d). [Color figure can be viewed in the online issue, which is available at wileyonlinelibrary.com.]

