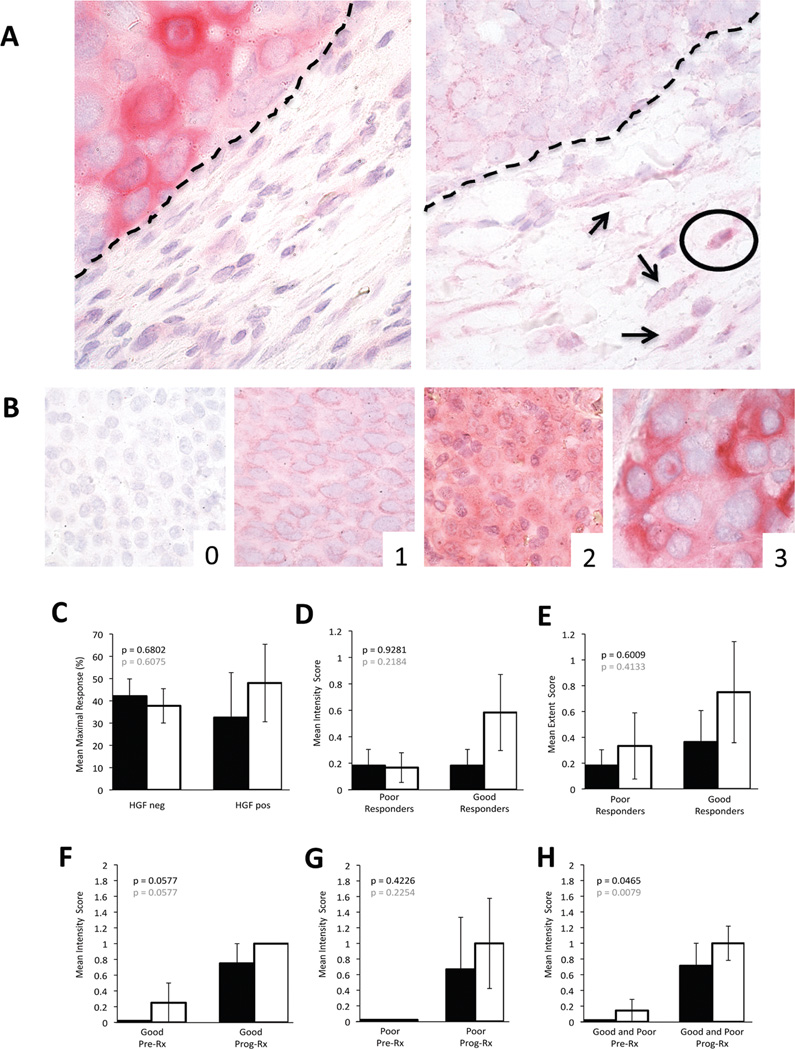
Figure 2. HGF expression in BRAF mutant patient melanomas.
A: Example of tumor HGF expression juxtaposed with negative stroma (left panel), scattered stromal cells with weak (arrows) to moderate (encircled) stromal HGF reactivity (right panel) [dashed line= tumor/stroma interface]. B: Example of tumor HGF grading (0–3).
C: Correlation of mean maximal response to BRAF inhibitor with peri-tumoral stromal (black bars) and melanoma cell (white bars) HGF expression in pre-treament samples. D: Mean intensity of HGF immunoreactivity for peri-tumoral stromal (black bars) and melanoma cells (white bars) in pre-treatment biopsies of poor versus good responders. E: Mean extent of HGF immunoreactivity for peri-tumoral stromal (black bars) and melanoma cells (white bars) in pre-treatment biopsies of poor versus good responders. F–H: Mean intensity of stromal cell HGF expression in good responders (F), in poor responders (G), and in good and poor responders combined (H) before BRAF inhibitor therapy (Pre) and upon progressive disease while on BRAF inhibitor (Prog). Note trend to an increase in HGF expression in progressing lesions in both stromal (black bars) and tumor cells (white bars) that reaches statistical significance when good and poor response groups are combined (H). Data for extent of HGF immunoreactivity in peri-tumoral stromal and melanoma cells before BRAF inhibitor therapy and upon progressive disease while on BRAF inhibitor treatment showed similar trends for good and poor responders when analyzed separately; the increase in HGF expression extent in progressing tumor samples reached statistical significance when good and poor responder groups were combined (data not shown).

