
Figure 1. Photostimulation of molecular layer interneurons.
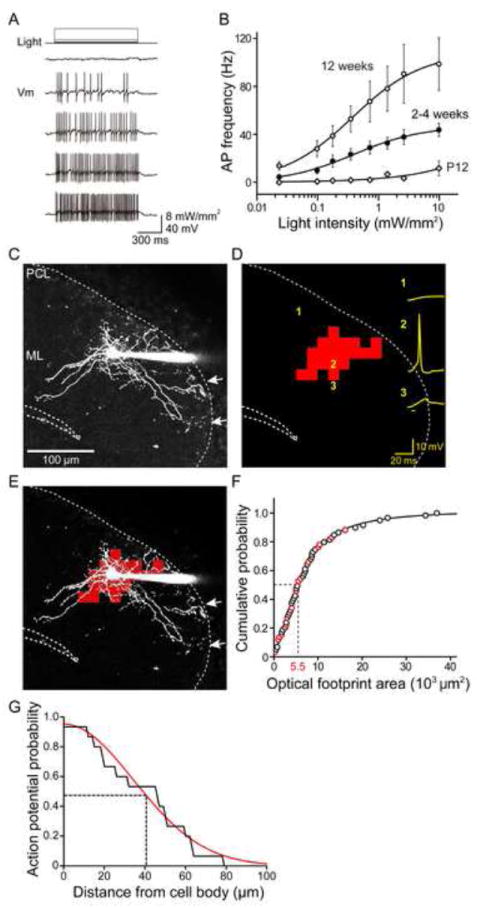
(A) Light-evoked changes in membrane potential (Vm) in ChR2-expressing MLI. Action potential frequency increased with increasing light intensity.
(B) Relationship between light intensity and frequency of light-evoked action potentials in MLI from transgenic mice of different ages. Curves are fits of the Hill equation. (P12, n = 8; 2-4 weeks, n = 18; 12 weeks, n = 8).
(C) Structure of a basket cell in the molecular layer (ML) filled with Alexa 594 dye via a patch pipette (right). Arrows indicate basket structures formed by the neuron in the PC layer (PCL).
(D) Scanning a laser light spot across the brain slice, while simultaneously measuring membrane potential changes (yellow) in the ChR2-expressing basket cell, revealed locations where photostimulation evoked action potentials in the basket cell. Red indicates the locations where action potentials were induced and the sum of these is the optical footprint of the basket cell. Numbers indicate positions where photoresponses shown at right were evoked, while bar below traces indicates light flash timing.
(E) Merger of basket cell image in C and optical footprint in D reveals that action potentials were evoked around the cell body and main dendritic region of the basket cell.
(F) Cumulative probability distribution of MLI optical footprint areas. Areas of optical footprints were measured in either cell-attached recordings (black circles) or whole-cell recordings (red circles). Median optical footprint area (dashed lines) was 5.5 × 103 μm2 (n = 59).
(G) Probability of overlap between axon and optical footprint (area where the light spots evoked action potentials in MLI) over the distance of axon from cell body (n = 15). The light spots evoked action potentials only over axonal regions that are near the cell body. Data are fit with a Gaussian function (red curve) and half-width at half maximum probability was 41 μm (dashed line).