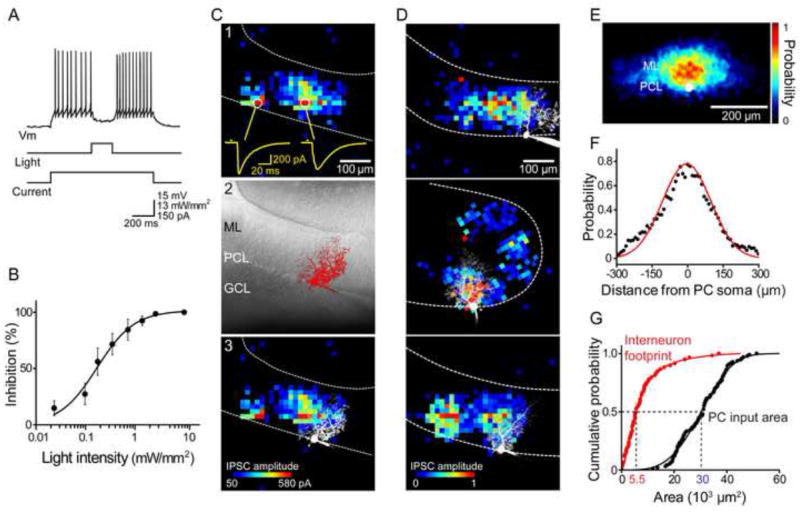
Figure 2. Photostimulation mapping of local inhibitory circuits.

(A) Optogenetic control of MLI-PC synapses. Photostimulation of MLI (middle trace) inhibited firing of a PC (top trace) which was depolarized by current injection (bottom trace).
(B) Relationship between light intensity and degree of inhibition of PC firing (n = 8).
(C) Photostimulation mapping of presynaptic ChR2-expressing MLI. 1) Locations where light evoked IPSCs in a PC were determined by scanning a laser light spot across the cerebellar slice. Examples of light-evoked IPSCs are shown as yellow traces below. Bar above traces indicates time of light flash. 2) Image of PC filled with Alexa 549 dye. ML, molecular layer; PCL, PC layer; GCL, granule cell layer. 3) Merger of map in C1 and image in C2 shows the spatial relationship between the postsynaptic PC and its presynaptic inputs. IPSC amplitude is indicated by the pseudocolor scale shown below.
(D) Three examples of PC inhibitory input maps. IPSC amplitude was normalized relative to the largest response measured in each cell and is indicated by the scale shown below. Images of dye-filled PCs are superimposed in white.
(E) Spatial distribution of inhibitory inputs was obtained by aligning many input maps (n = 39) and averaging the probability of evoking IPSCs at a given location (scale at right) across the maps. PC somata are shown in white and sagittal plane of the molecular layer runs from left to right.
(F) A line scan (black points) along the sagittal axis of the map shown above reveals the spatial distribution of input probability within the molecular layer. Red curve is a Gaussian fit.
(G) Calculation of MLI convergence onto PCs. Comparison between the cumulative probability plots of input field areas of PCs (black, n = 96) and MLI optical footprints (red, n = 59) indicates that the median value (dashed lines) of the input areas is 5.5 times larger than the median of the optical footprints. This means that at least 5-6 interneurons provide inhibitory inputs to a PC.
