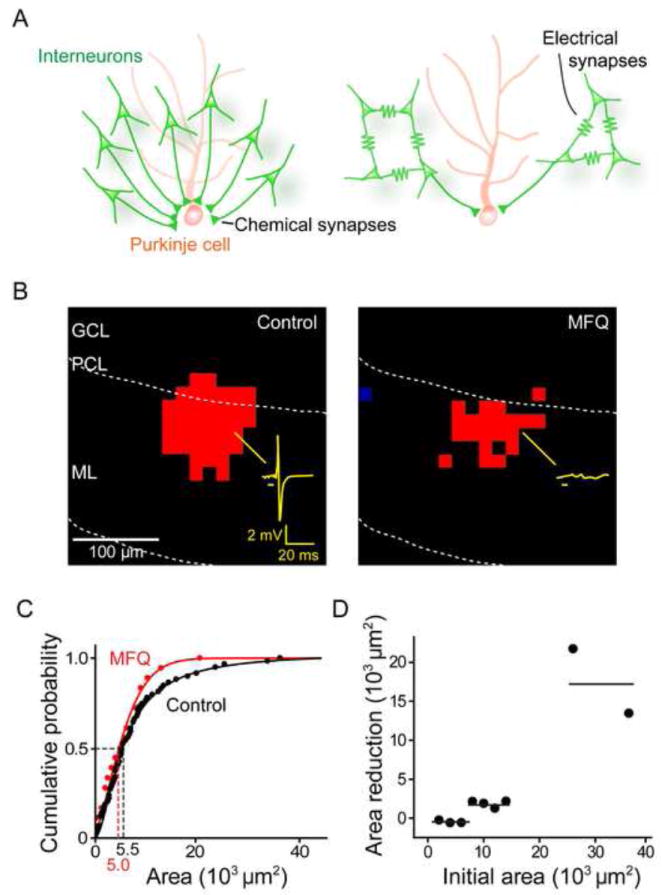
Figure 3. Cerebellar interneurons are electrically coupled.

(A) Two models for the convergence of MLI inputs onto a PC, distinguished according to the absence (left) or presence (right) of contributions from electrical synapses between MLI.
(B) Optical footprints of interneurons were reduced by blocking electrical synapses with MFQ (50 μM). Interneuron responses to light were recorded in the cell-attached configuration, with an example of a light-evoked action potential illustrated by the yellow trace in the left panel. Bar below trace indicates light flash timing, while red pixels indicate locations where light evoked action potentials in the absence (left) and presence (right) of MFQ. ML, molecular layer; PCL, PC layer; GCL, granule cell layer.
(C) Comparison of optical footprint area of MLI in control conditions (black) and in the presence of MFQ (red).
(D) Relationship between optical footprint area and the reduction of footprint area caused by MFQ treatment. MLI with the largest optical footprints showed the largest reductions in optical footprint area in response to MFQ treatment. Points indicate footprint areas, binned in 2000 μm2 intervals, while horizontal lines indicate hypothetical trends in the relationship.
