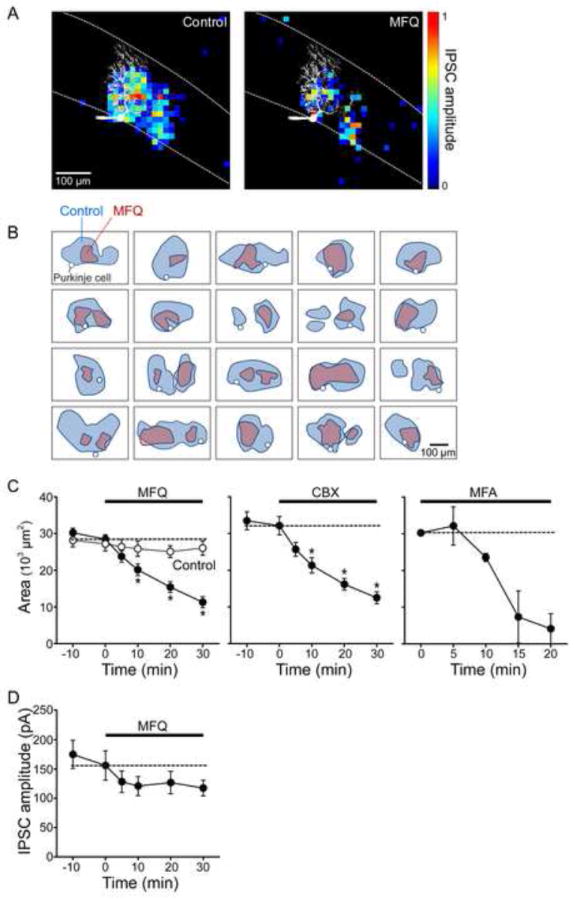
Figure 4. Electrical synapses contribute to inhibitory input field of Purkinje cells.

(A) The area of the inhibitory input field of a PC (left panel) was reduced by treatment with MFQ (50 μM; right panel). Pseudocolor scale indicates the normalized amplitude of light-evoked IPSCs for each location. Image of dye-filled PC is shown in white.
(B) Gallery of input field maps measured for 20 different PCs before and after MFQ treatment. Outlines of input fields measured in control conditions are shown in blue and those measured in the same experiments after MFQ treatment are shown in pink. In every case, MFQ treatment reduced the area of the input field. White circles indicate the location of somata of PCs used for input field determinations.
(C) Time course of changes in the mean area of inhibitory input field of IPSCs during MFQ (50 μM, n = 20), CBX (200 μM, n = 18) and MFA (200 μM, n = 2) treatment. Asterisks indicate time points where drug treatment caused significant (p<0.001) reductions.
(D) Time course of changes in the mean amplitude of IPSCs during MFQ treatment. While input field area was significantly reduced by MFQ (C), IPSC amplitude was not (D).
