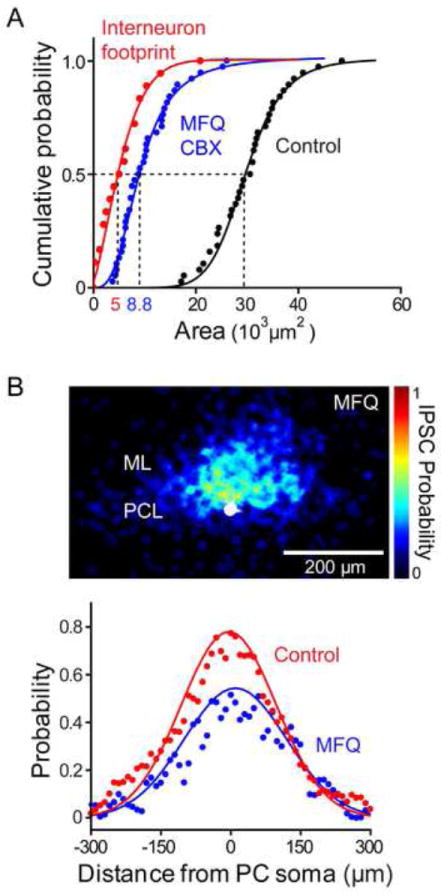
Figure 6. Quantification of the contribution of electrical synapses to interneuron convergence.

(A) Calculation of amount of convergence of interneuron inputs onto a PC, as in Figure 3G, in control conditions (black) or in the presence of a gap junction blocker (CBX or MFQ; blue, n = 38). Median area of input fields measured after blocking electrical synapses (8.8 × 103 μm2) was almost 3-fold smaller than in control conditions (3.0 × 104 μm2), but was 1.8-fold larger than the area of MLI optical footprints (5.0 × 103 μm2, n = 18) measured in the presence of gap junction blockers (red). This indicates that MLI circuits providing inhibitory inputs to a PC consist of roughly 2 direct chemical synapses with several additional MLI converging via electrical synapses.
(B) Upper: Spatial distribution of inhibitory inputs (upper panel) measured in the presence of MFQ, determined as in Figure 3E (n = 20). PC somata are shown in white and pseudocolor scale indicates the probability of evoking an IPSC at a given location. Lower: A line scan (blue points) along the sagittal axis of the map shown above reveals that while the overall probability of evoking an IPSC was significantly reduced after MFQ treatment, there was little change in the overall spatial distribution of inhibitory inputs in comparison to control conditions (red points). Continuous curves indicate fits of Gaussian functions.
