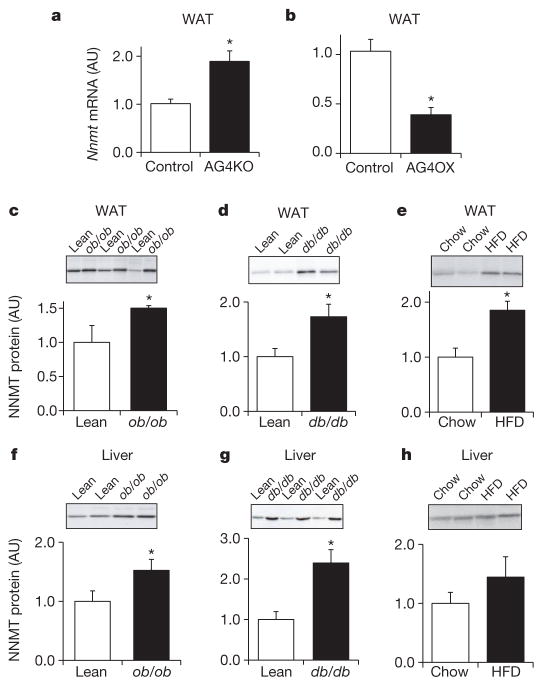
Figure 1. NNMT expression is increased in WAT and liver of obese and insulin-resistant mice.
a, b, Nnmt mRNA expression normalized by cyclophilin in WAT of adipose-specific Glut4 knockout (AG4KO) mice and aP2-Cre controls (n =4 per group) (a) and adipose-specific Glut4 overexpressing (AG4OX) and wild-type littermate controls (n =6 per group) (b). c–e, NNMT protein levels in WAT of ob/ob mice (n =8) and lean controls (n =4) (c); db/db mice and lean controls (n =7 per group) (d), and high-fat diet (HFD)-fed (n =6) and chow-fed mice (n =7) (e). f–h, NNMT protein levels in liver of ob/ob mice (n =9) and lean controls (n =6) (f); db/db mice and lean controls (n =7 per group) (g); and HFD-fed and chow-fed mice (n =6 per group) (h). Actin was used as a control for western blot analysis and the levels were not different between lean and obese mice. AU, arbitrary units. Error bars, ±s.e.m; *P <0.05.

