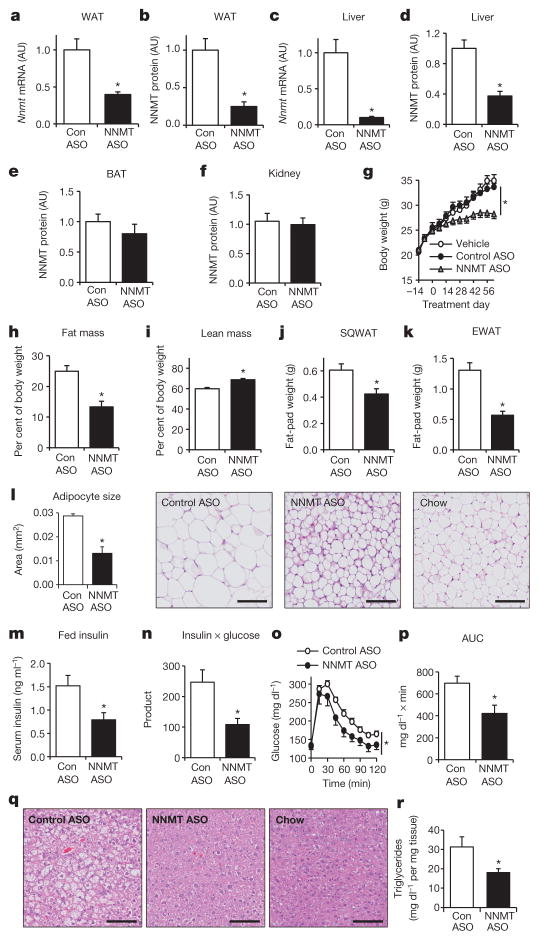
Figure 2. Nnmt knockdown prevents diet-induced obesity and insulin resistance.
a–f, Knockdown efficiency of Nnmt-ASO. mRNA expression was normalized by cyclophilin and protein levels were corrected with actin levels: Nnmt mRNA (a) and NNMT protein in WAT (b); Nnmt mRNA (c) and NNMT protein in liver (d); NNMT protein in brown adipose tissue (BAT) (e) and kidney (f). g, Body weights of C57BL/6 mice fed a high-fat diet and treated with Nnmt ASO, control ASO, or vehicle (saline) for 8 weeks. h, Fat mass as a percentage of body weight. i, Lean mass as a percentage of body weight. j, Subcutaneous WAT (SQWAT) fat-pad weights. k, Epididymal WAT (EWAT) fat-pad weights. l, Epididymal adipocyte cross-sectional area and haematoxylin and eosin (H&E)-stained sections of SQWAT. m, Serum insulin levels. n, Glucose × insulin product (ng ml−1 × mg dl−1) in the fed state. o, Intraperitoneal glucose tolerance test. p, Area under the curve (AUC) of the glucose tolerance. q, H&E stain of liver sections of HFD-fed Nnmt-ASO-and control-ASO-treated mice, and of chow-fed mice. r, Hepatic triglyceride levels in Nnmt- and control-ASO-treated mice. The scale bars in l and q represent 100 μm; n =8 per group for a–p, n =13 per group for r. AU, arbitrary units. Error bars, ±s.e.m.; *P <0.05.

