Figure 2.
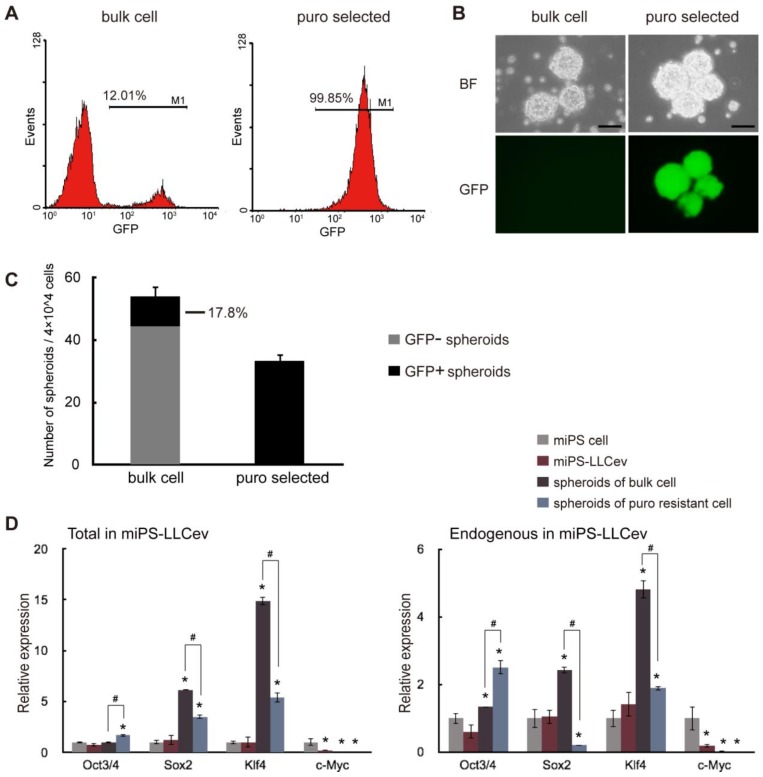
miPS-LLCev cells possess self-renewal capacity. (A) FACS analysis shows GFP population in bulk and puro selected miPS-LLCev cells. (B) Sphere formation assay in serum-free medium shows spherogenic potential of both GFP negative (bulk cell) and GFP positive (puro selected) miPS-LLCev cells. Scale bars: 100 µm. (C) 4×10⁴ bulk or puro selected single cell suspension were applied to serum-free condition, the number of GFP+ and GFP- spheroids above 100 µm were scored after 4 days. The assay was performed in triplicate and the error bars indicate the difference in the total number. (D) qRT-PCR analysis of four transcription factors Oct3/4, Sox2, Klf4 and c-Myc expression levels in the indicated samples. The products of coding regions and endogenous transcripts are regarded as total and endogenous. Relative expression values are normalized to Gapdh and conducted in triplicate. Student t-test was used to compare the expression level between unique sample and miPSCs. Each asterisk shows the significance of P <0.05. One-way ANOVA followed by post hoc Tukey analysis was used to assess the significance of the genes expression between miPS-LLCev, 'spheroids of bulk cell' and 'spheroids of puro resistant cell'. Each '#' shows the significance of P <0.05.

