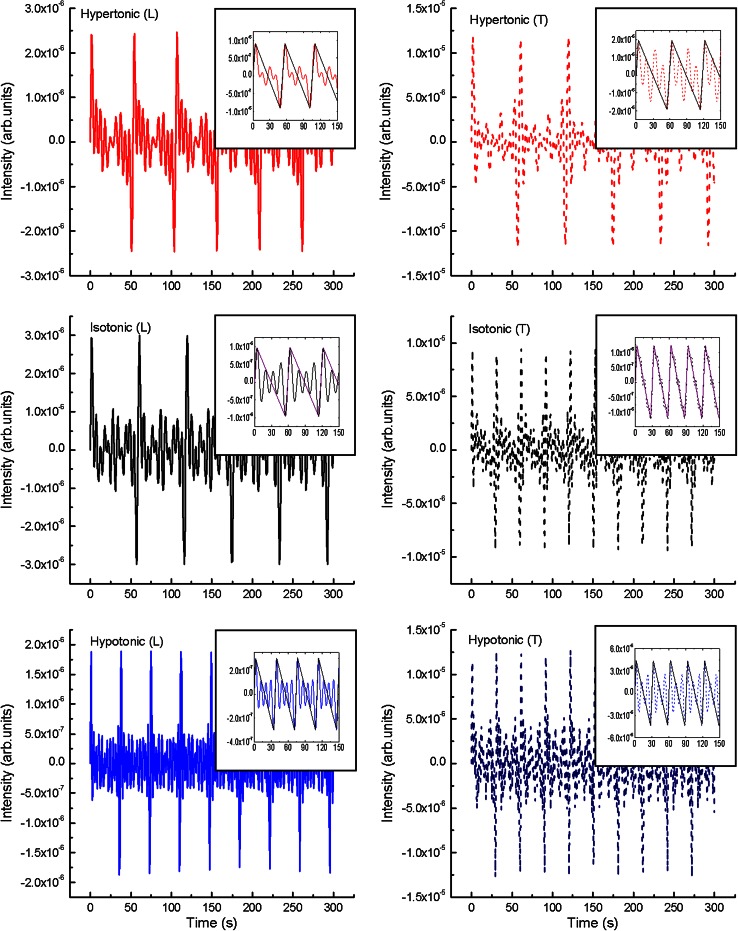
Fig. 6.
Calculated inverse Fourier transform. Data presented for the sum of the first 11 harmonics [hypertonic (L, T), isotonic (L, T)] and 13 harmonics [hypotonic (L, T)]. The sum of four first harmonics (insets) calculated for data indicated in Figs. 3, 4 and 5. The underlying triangle waveform, corresponding to wall building/relaxation processes, indicated

