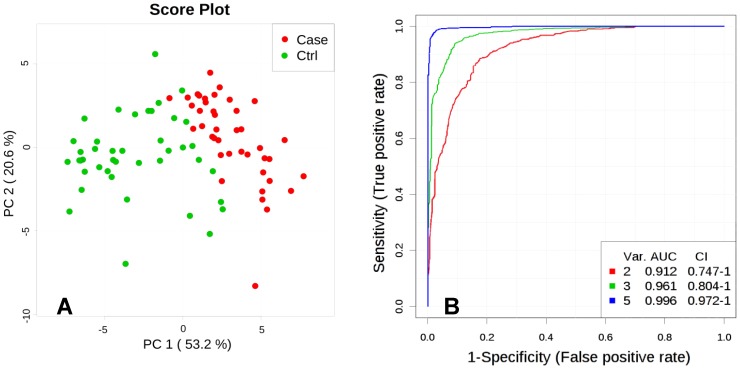
Figure 2.
A. Principal Component Analysis (PCA), PC1 vs. PC2. Score plot shows separation between Fetal Growth Restriction (FGR) Cases (red) and Controls (green) based on metabolites abundance significantly different (p<0.01) between the groups. B. Multivariate ROC curve, based on metabolites which were statistically different between Control and FGR Case groups (p<0.01). Var. designated as number of discriminating metabolites (lactate, levulinate, 2-methyloctadecanate, tyrosine, margarate; significance to the model decreasing as listed) included in the AUC (Area Under the Curve) calculations.

