
Figure 1.
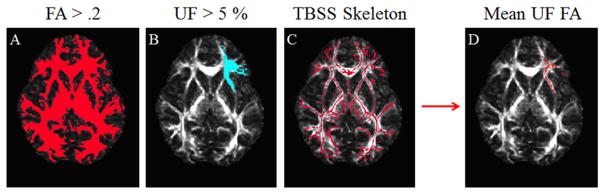
Binary masks overlaid on axial slice of FA values in MNI space (z = 2mm); overlay is colored in red or blue, indicating which voxels to include in the final analysis. Panel A shows a binary mask based on FA values. Panel B shows a binary mask of uncinate fasciculus created from the Johns Hopkins University white matter tractography atlas. Panel C shows a binary mask created from the Tract-Based Spatial Statistics skeleton. Panel D shows the multiplication of masks A, B, and C. Voxels in the resultant mask (D) contributed to a mean for the final analyses. Images displayed in radiological convention.