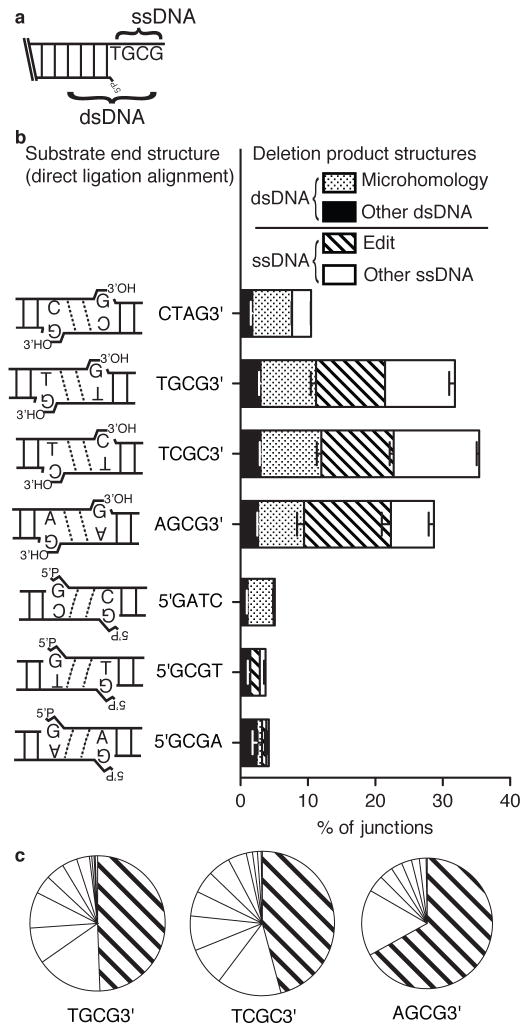
Figure 3. Characterization of junctions with deletions.
a) Deletions were categorized according to whether deleted sequence was entirely limited to the single stranded overhangs (ssDNA deletion), then further categorized as whether the junction equaled the “edit” product described in Fig 1a, iii, vs. all other ssDNA deletions. Similarly, junctions where deleted sequence extended into flanking double stranded DNA (dsDNA deletion) then classed as occurring at a flanking sequence identity (microhomology mediated) or not (other dsDNA) b) Proportions of junctions with deletion (Fig. 1a, iii and iv) from Fig. 2c results were further categorized as in panel a). Error bars represent the range of results from the two libraries. c) The area of each slice is representative of the proportion of a different junction sequence with ssDNA deletion, as a fraction of the total sequences with ssDNA deletion (Fig. 3a, Supplementary Table 3). The proportion of edits (Fig. 1A, iii) is distinguished from deletions not guided by overhang sequence complementarity.

