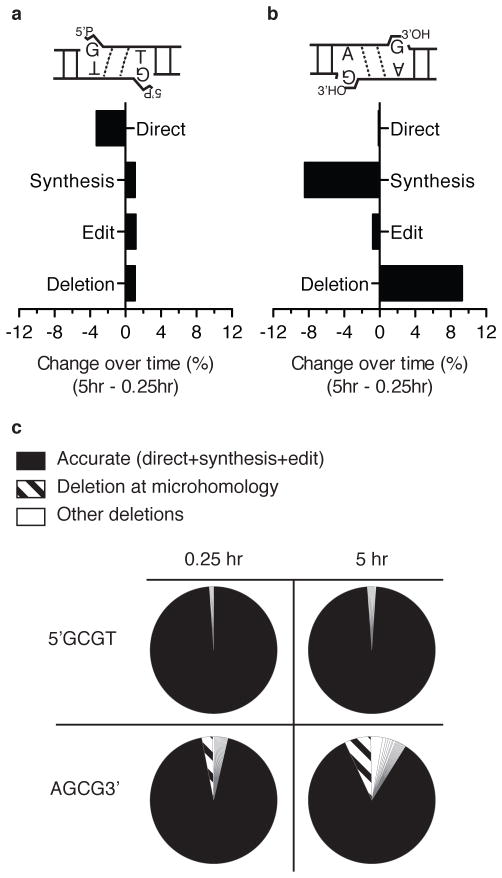
Figure 4. Changes in resolution path over time in the cell.
a), and b) The change in proportion (%) of resolution path, comparing product recovered 5 hrs vs 15 minutes in cells, for 5′GCGT (a) and AGCG3′ (b). c) The frequency of different junctions, distinguishing accurate (filled section), microhomology directed deletions (diagonal bars), and all other deletions (open sections) for 5′GCGT vs AGCG3′ substrates, after 15 minutes versus 5 hours in cells.

