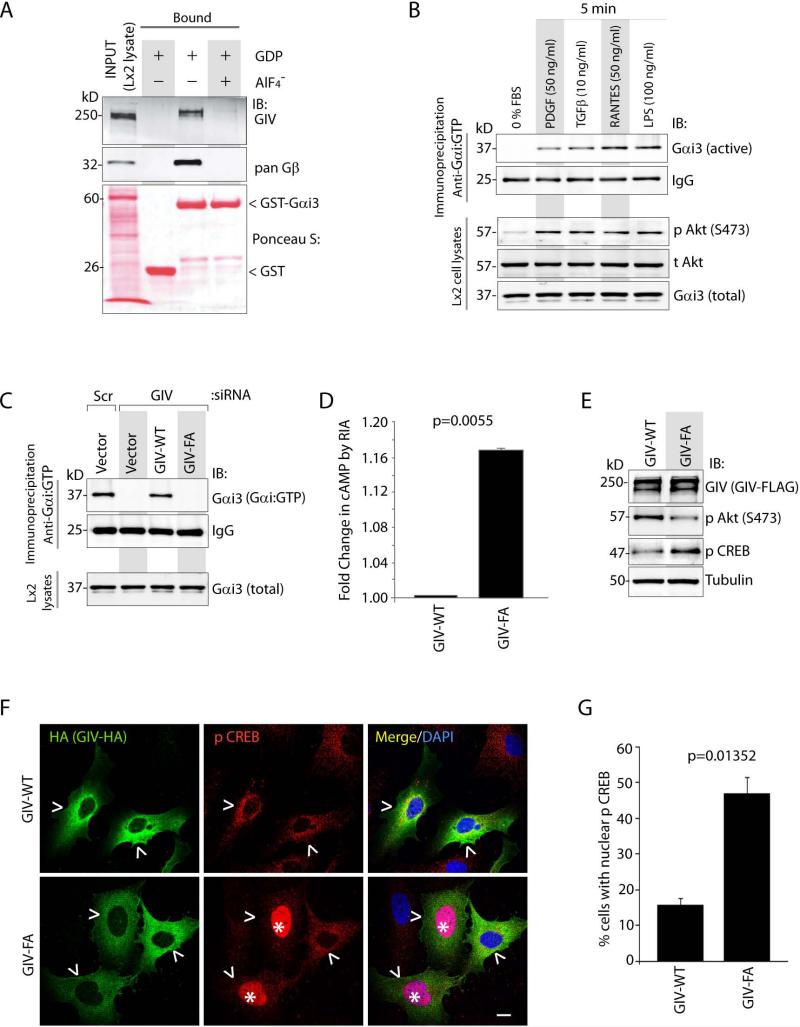
Figure 7. GIV activates Gαi and suppresses the anti-fibrogenic cAMP/PKA/pCREB signals in HSCs.
(A) Lysates of Lx2 cells were used as the source of full-length GIV in pull-down assays with GST or GST-Gαi3 preloaded with GDP alone (inactive) or with AlF −4 (active), and immobilized on glutathione beads. Bound GIV and Gβγ were analyzed by immunoblotting (IB). The GST proteins are shown by Ponceau S stain.
(B) Serum-starved Lx2 cells were stimulated with a variety of ligands prior to lysis. Equal aliquots of lysates were subjected to immunoprecipitation with Gαi:GTP mAb, which recognizes active conformation of the G protein and immunecomplexes were analyzed for Gαi3 by immunoblotting (IB).
(C) Lx2 cells treated with control (Scr) or GIV siRNA were transfected with siRNA resistant GIV-WT or GIV-FA and maintained in 0.2% FBS. Lysates were analyzed for active Gαi3 as in B.
(D) Lx2 cells transfected with GIV-WT or GIV-FA were stimulated with PDGF-BB prior to lysis. Lysates were analyzed for cAMP by RIA and normalized to total protein. Results are displayed as fold change in cAMP (Y axis).
(E) Lx2 cells transfected with GIV-WT or GIV-FA were analyzed for GIV, phospho(p)Akt, phospho(p)CREB and tubulin by immunoblotting (IB). The ratio of pCREB/tubulin was ~2.5 fold higher in cells expressing GIV-FA than in those expressing GIV-WT, as determined by band densitometry.
(F) Lx2 cells infected with GIV-WT-HA or GIV-FA-HA adenoviruses were maintained in 0.2% FBS, fixed and stained for HA (GIV, green), phospho(p)CREB (red) and DAPI/DNA (blue) and analyzed by confocal microscopy. Arrowhead = GIV expressing cell. Star = nuclear p CREB. Scale bar = 10 μm. Results display % cells with nuclear pCREB (Y axis) (G). Error bars represent mean ± S.D. n = 3. Statistical significance was assessed with two-tailed Student's t test.

