
Fig. 1.
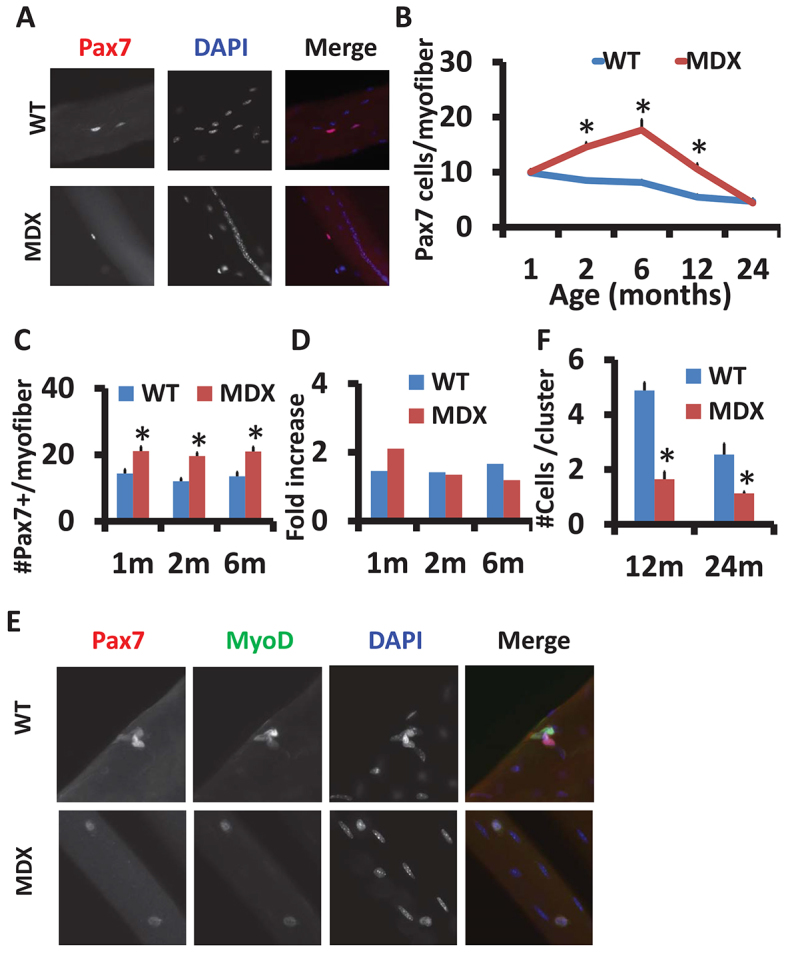
Decline of satellite cells number and activity with age in mdx mice. (A) Representative images of satellite cells in single EDL myofibers from WT and mdx mice, labeled with Pax7 (red). Nuclei were counterstained with DAPI (blue). Central nuclei indicate muscle regeneration in mdx mice. (B) The mean±s.e.m. satellite cell number per EDL myofiber from WT and mdx mice at different ages is shown (n=3 mice with more than 20 fibers analyzed in each mouse at each indicated age). (C) Mean±s.e.m. satellite cell number per EDL myofiber for WT and mdx mice after CTX treatment at the indicated ages (n=3). (D) The CTX-stimulated relative fold increase of satellite cells calculated from data in B and C. (E) Representative images of satellite cell clusters on cultured (72 hours) single myofibers isolated from 24-month-old WT and mdx mice, labeled with Pax7 (red) and MyoD (green). Nuclei were counterstained with DAPI (blue). (F) Quantification (mean±s.e.m.) of satellite cell number per cluster based on data in E (n=3 independent experiments with more than 20 clusters analyzed in each experiment). *P<0.05 compared with WT.