
Figure 2.

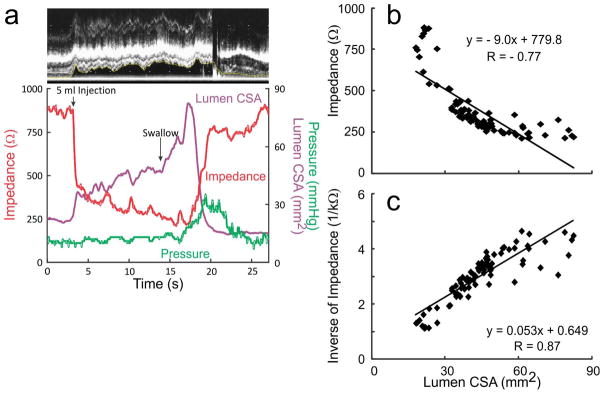
(A) (a) An example of temporal correlation between changes in the lumen CSA, impedance and pressure with a 5ml swallow. (b) It shows the correlation between changes in luminal CSA and changes in impedance during the entire distension period. (c) It shows the increased r value when inverse of impedance was plotted against the luminal CSA.
(B) (a) An example of record between the temporal correlation between changes in the lumen CSA, impedance and pressure during esophageal injection followed by a swallow. (b) Correlation between impedance strongly correlated with lumen CSA. (c) Correlation analysis between lumen CSA and inverse impedance with stronger r values compared to impedance.