Figure 4.


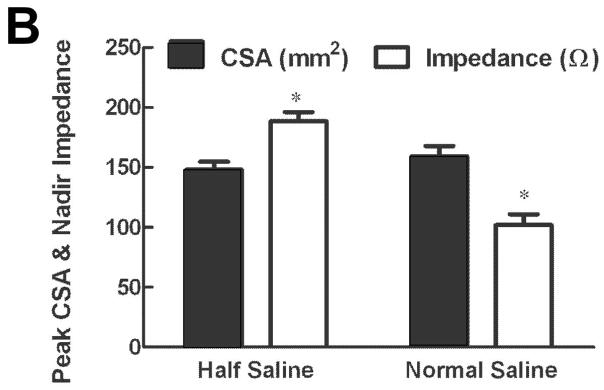
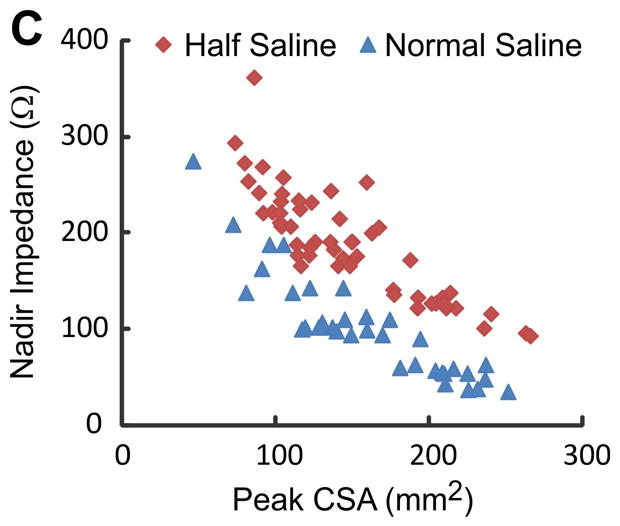
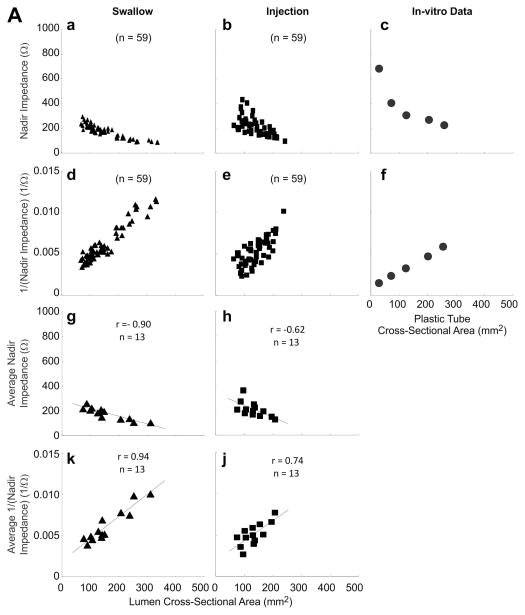
(A) Relationship between peak CSA, nadir impedance and inverse of impedance or conductance: First and third rows show the relationship with impedance (panels a, b, c, g and h) and second and fourth rows with conductance (panels d, e, f, k and j) for all of the swallows, injections and plastic tubes. Data points shown in triangles are from swallows, squares are from bolus injections and circles from the in-vitro experiments where impedance values were measured in plastic tubes of known dimensions. Note, that the r values are higher with conductance (inverse impedance) compared to impedance. (B) Mean peak CSA and nadir impedance value with two concentrations of saline. Note that the peak CSA was not different but the nadir impedance values are smaller with the 1N saline compared to 0.5 N saline (*p<0.001). (C) Graph shows the scatter plot of peak luminal CSA and nadir impedance value with half saline and normal saline group. Nadir impedance values were significantly lower in normal saline group without difference in peak CSA value between both groups.

