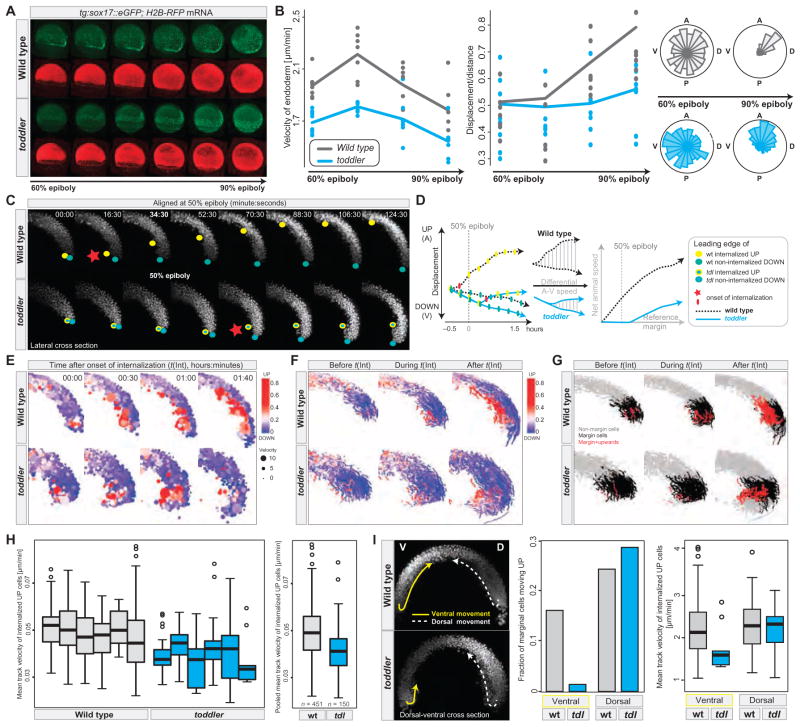
Fig. 3. Abnormal gastrulation movements in toddler mutants.
(A and B) Analysis of endodermal cell migration in sox17::eGFP transgenic wild-type and toddler mutant embryos by confocal microscopy. Green, endodermal cells (marked by sox17::eGFP); red, nuclei [human histone2B-RFP (H2B-RFP) mRNA injection]. (A) Still images of maximum intensity projections of a time-lapse movie from 60 to 90% epiboly (movies S1 and S2). (B) Quantification of the average (median) velocity of endodermal cells (left), displacement versus distance travelled (middle), and directionality (rose-plots; right) in wild-type (gray) and toddler mutant (cyan) embryos. Each dot represents the average speed (or the ratio between displacement versus distance travelled) of all endodermal cells tracked within a single embryo during a 45-min time interval with respect to its previous position [speed = actual distance (micrometers)/time (min)]. Shown are the data for four consecutive 45-min time windows. Roseplots display the random movement of endodermal cells during early gastrulation and the more directional migration at later stages [animal (A), posterior (P), dorsal (D), ventral (V)]. (C to I) Analysis of early gastrulation movements in H2B-RFP mRNA injected wild-type and toddler mutant embryos by light-sheet microscopy (single-plane illumination microscopy). (C to H) Internalization and animal pole–directed movement of lateral mesendodermal cells are reduced in toddler mutants. Analyses are shown for lateral cross sections of a time-lapse movie (movie S4) of a wild-type–toddler mutant embryo pair, imaged in parallel at 90-s intervals within a single experiment. (C) Still images of maximum intensity projections of 40-μm lateral cross sections (20 z-slices) during the time of internalization (time in minutes:seconds). Movies were aligned at 50% epiboly (48:00). Leading edges of internalizing mesendodermal cells (yellow dots) and vegetally moving cells (green dots) highlight the opposing paths of cells during gastrulation. Red stars mark the onset of cell internalization. (D) Comparison of animally and vegetally directed migratory paths of the wild-type and mutant embryo pair shown in (C). Frame-to-frame displacements (plotted on the left) were used to derive the net animal pole–directed cell movement. Toddler mutants (cyan) show delayed onset of internalization and reduced step-to-step and net animal pole–directed movement. (E to G) Cell tracking and digital analysis of gastrulation movements. (E) Position, speed (dot size), and directionality [color-coded from blue (vegetal movement) to red (animal movement)] of tracked cells during and after the time of internalization [t(Int)]. Movies were aligned to the onset of internalization [t(Int) = 00:00; time in hours:minutes]. (F and G) Cell tracks before (t < −5 min), during (−5 min < t < 1 hour), and after (t > 1 hour) internalization in wild-type and toddler mutant embryos. In (F), tracks were color-coded on the basis of the total number of animal pole–directed (red) or vegetal pole–directed (blue) movements, normalized to the total number of frames per track. In (G), tracks were color-coded on the basis of their relative position and directionality with respect to the margin at the time of internalization (margin cells: cells located within 100 μm above the margin at the onset of internalization). Gray, nonmargin cells; black, margin cells; red, internalizing and upward-moving margin cells. (H) Quantification of the mean velocity of internalizing, animal pole–directed movement in wild-type and toddler mutant embryos. Mean track velocities were obtained from cell-tracking data derived from lateral cross sections of six wild-type (gray) and six toddler mutant (cyan) embryos, imaged in parallel in three independent experiments. Pooled wild-type and toddler mutant mean track velocities are plotted on the right (n = number of cell tracks). (I) Toddler mutant embryos are defective in ventrolateral but not dorsal internalization. (Left) Still image of maximum intensity projections of 40-μm dorsal-ventral cross sections (20 z-slices) of a wild-type–toddler mutant embryo pair 110 min after the onset of internalization. Arrows highlight the paths that the leading internalizing cells took on dorsal (D, dashed white line) and ventral (V, solid yellow line) sides of the embryo. Ventral movement toward the animal pole is severely reduced in the toddler mutant embryo, whereas dorsal internalization occurs normally. (Right) Quantification of the fraction and speed of internalizing marginal cells based on their positioning in the embryo (dorsal versus ventral) and genotype [wild type (gray) versus toddler mutant (cyan)] (see also movie S6).

