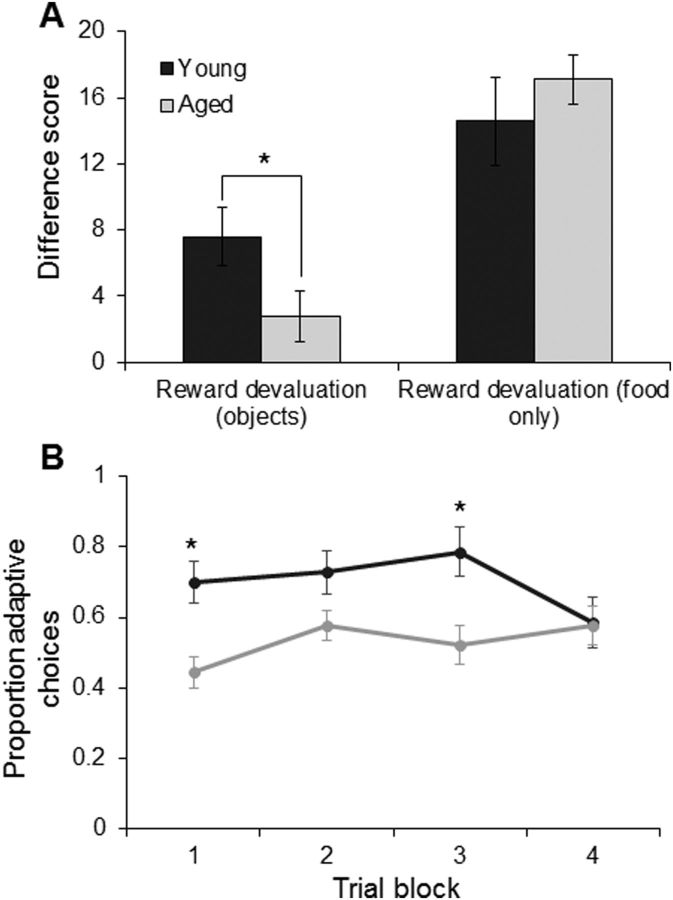
Figure 4.
Reward devaluation in young and aged monkeys. A, The x-axis represents the type of reward devaluation tested (object-associated or food only). The y-axis represents the mean difference score, which reflects the degree to which an animal chooses the higher valued reward (nonsatiated) over the satiated reward. There was a main effect of objects or no objects on task performance (p < 0.0001; repeated-measures) and a significant interaction between devaluation task type and age (p < 0.07). Post hoc analysis indicated that this interaction effect was the result of the aged monkeys performing significantly worse on the reward devaluation task with objects, compared with young monkeys (p < 0.06; Tukey). In contrast, when only the food was presented to the monkeys used, there was no significant difference in the degree to which reward choice was affected by previous satiation (p = 0.40; Tukey). Error bars indicate ± SEM. B, The y-axis represents the proportion of adaptive responses (a choice of the object not associated with the nondevalued food item) as a function of blocks of five trials (x-axis). Trial block did not have a significant effect on production of adaptive responses (p = 0.11; repeated-measures), but this did significantly vary as a function of age group (p < 0.01). Error bars represent ±1 SEM. *p < 0.1.

