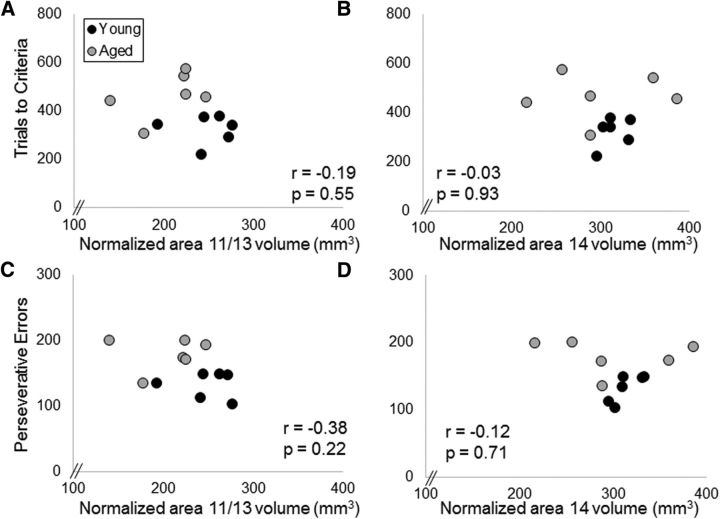
Figure 9.
OFC volume and reversal learning performance. The y-axes represent the mean number of trials to criteria (A, B) and perseverative errors (C, D) for reversal learning area 11/13 of the OFC (A, C), and area 14 of OFC (B, D) for young monkeys (dark gray) and aged monkeys (light gray). There were no statistically significant relationships between the reversal learning performance measures and OFC volume for either the 11/13 or area 14 subregions.

