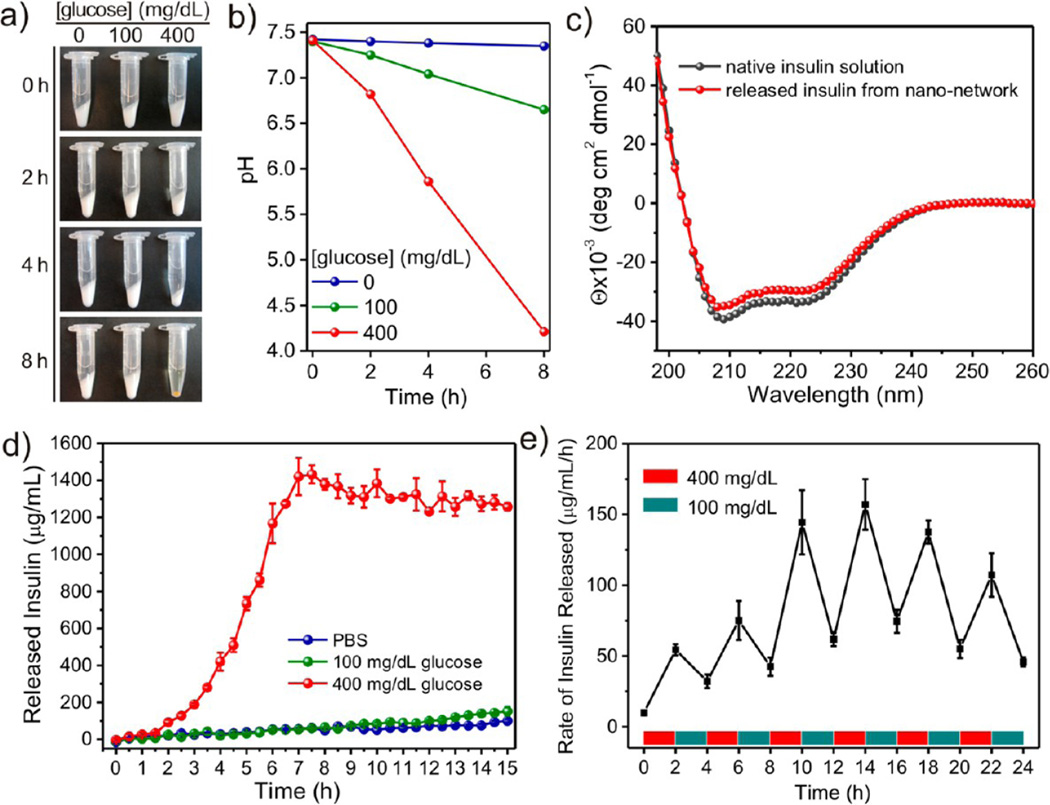
Figure 3.
Glucose-responsive degradation of nano-network and insulin release. (a) Pictures of the nano-network incubated in different glucose concentrations in 1× PBS solution: 0, 100, and 400 mg/dL at 37 °C over time. (b) Relevant pH changes in different incubation solutions with nano-networks. (c) CD spectra of insulin solution and insulin released from the nanonetwork incubated with 400 mg/dL glucose at 37 °C for 8 h. (d) In vitro accumulated insulin release of the nano-network in different glucose concentrations at 37 °C. (e) Self-regulated profile of the nano-network presents the rate of insulin release as a function of glucose concentration. Data points represent mean ± SD (n = 2) in (a), (d), and (e).

