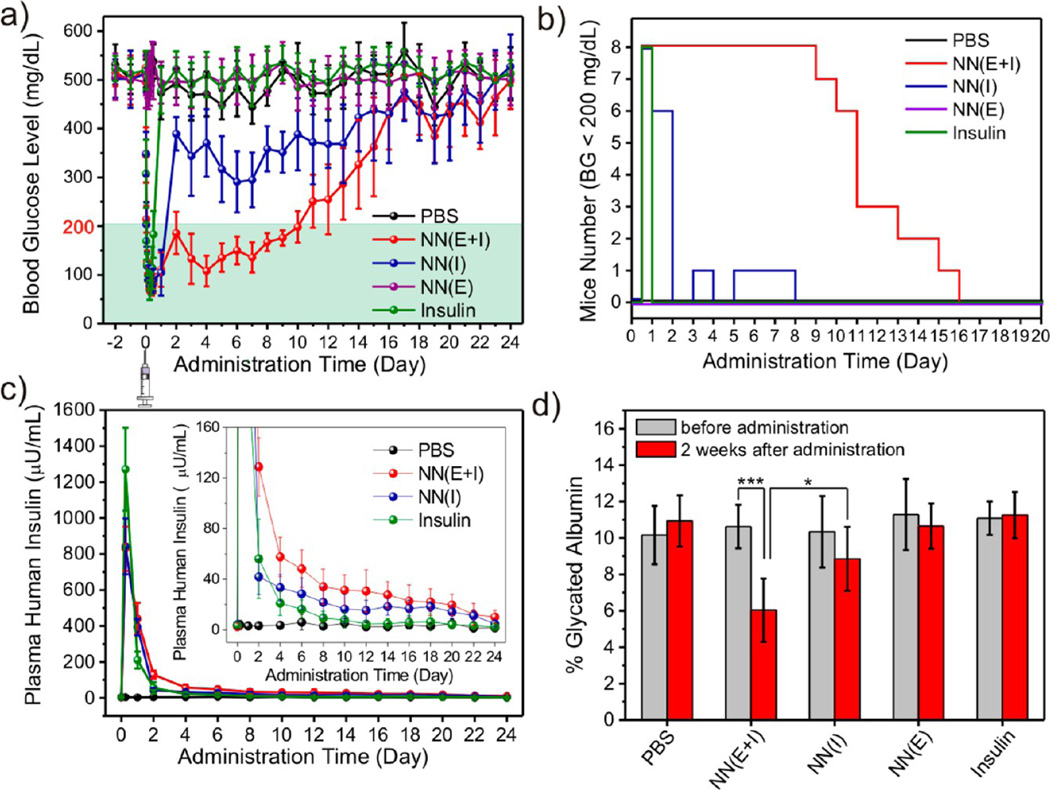
Figure 4.
In vivo studies of the nano-network for type 1 diabetes treatment. Blood glucose levels (a) and plasma human insulin concentration (c) in STZ-induced C57B6 diabetic mice after subcutaneous injection with 1× PBS, nano-network encapsulated insulin and enzymes (NN(E+I)), nano-network encapsulated insulin only (NN(I)), nano-network encapsulated with enzymes only (NN(E)), or pure insulin solution. (b) Changes of the mice number in different groups within the normoglycemic range (<200 mg/dL) over the administration time. (d) Glycated albumin percentages of mice treated with PBS, NN(E+I), NN(I), NN(E), and insulin solution. Student's t-test: *p < 0.05, ***p < 0.001. Data points represent mean ± SD (n = 8).

