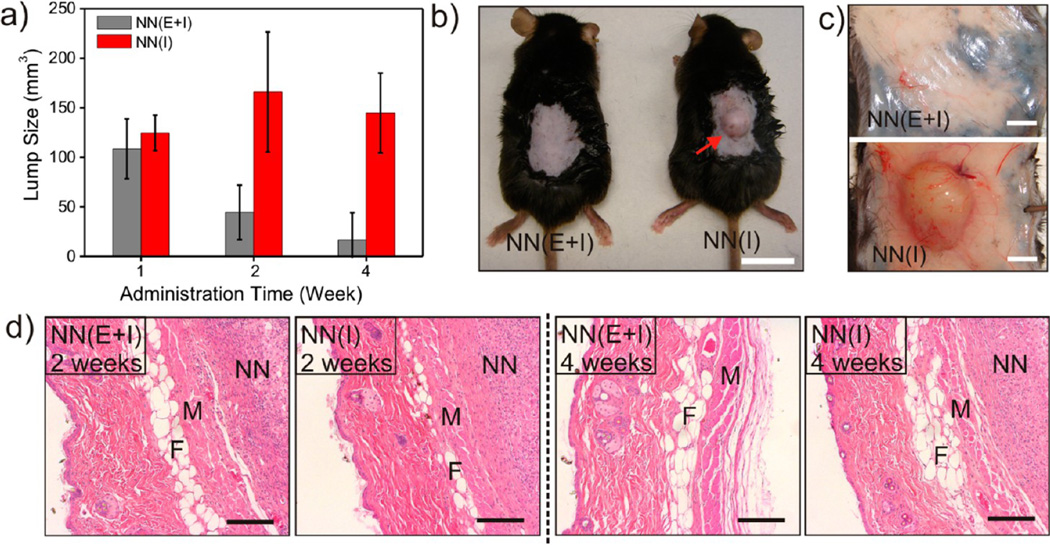
Figure 5.
In vivo biocompatibility analysis. (a) Changes of lump sizes in the injection sites of STZ-induced C57B6 diabetic mice treated with NN(E+I) and NN(I) over time. (b) Pictures of mice dorsum and relevant skins (c) treated with subcutaneous injection of NN(E+I) or NN(I) after 4 weeks. Scale bars: 1 cm for (b) and 2mm for (c). (d) H&E stained sections of subcutaneously injected NN(E+I) or NN(I) with surrounding tissues after 2 and 4 weeks, respectively. The regions of skin muscles, fat tissues, and nano-networks are indicated by M, F, and NN, respectively. Scale bar: 200 µm.

