
Figure 2. SIK2 is required for glucose-stimulated insulin secretion at a step downstream of depolarization.
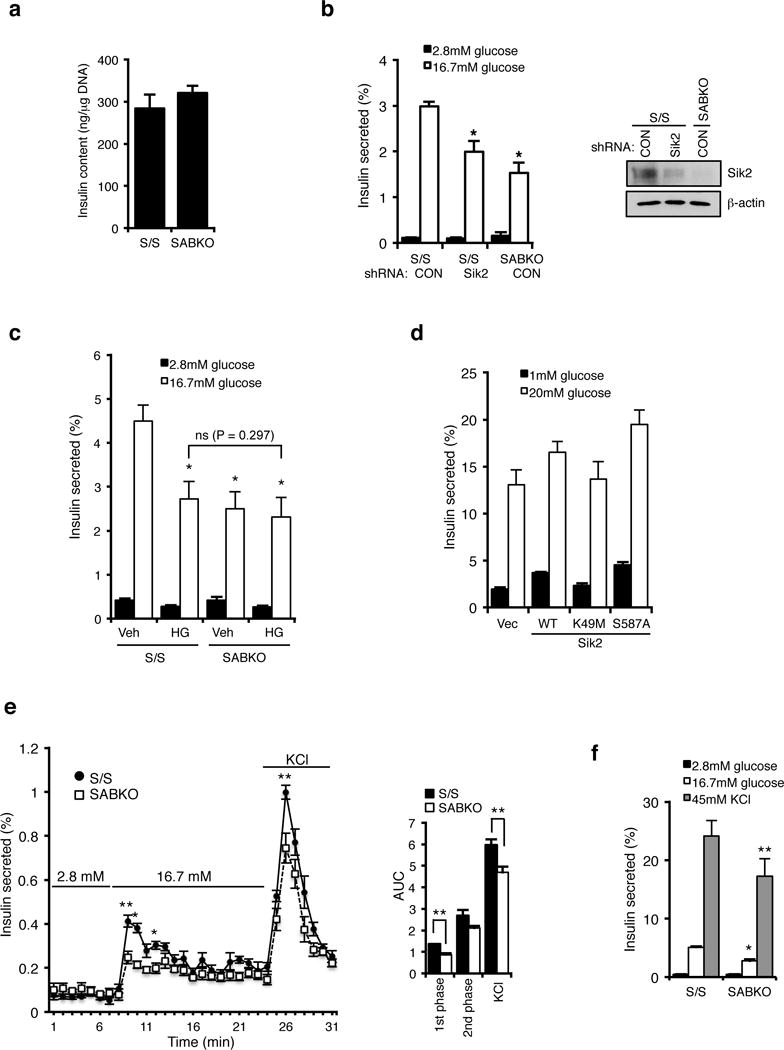
(a) Insulin content (ng insulin/μg DNA) is unchanged in control S/S (n= 3 mice) and SABKO (n= 3 mice) islets. (b) (Left) Insulin secretion from S/S (n= 3 mice for each condition) and SABKO (n= 3 mice) islets infected with control or SIK2 shRNA. Islets were treated with low (2.8 mM) and high (16.7 mM) glucose for 1 hr. (Right) Western blot analysis of SIK2 levels in islets indicated in the left panel. Data is representative of three independent experiments. (c) Insulin secretion from S/S (n= 3 mice for each condition) and SABKO (n= 3 mice for each condition) islets pre-treated with DMSO or pan-Sik inhibitor HG-9-91-01 (0.5 μM) for 24 hr followed by incubation with low (2.8 mM, 1 hr) and high (16.7 mM, 1hr) glucose in the presence or absence of 0.5 μM HG-9-91-01. (d) Insulin secretion from MIN6 cells infected with SIK2 WT, kinase inactive (K49M), or constitutively active (S587A) mutant. Cells were treated with low (1 mM) and high (20 mM) glucose for 1 hr. Data are mean ± s.d. from n=3 technical replicates from a single experiment, and are representative of three independent experiments with consistent results. (e) Glucose stimulated insulin secretion assay by perifusion of 75 islets from control S/S (n=3 mice) and SABKO (n=3 mice) mice. (Left) Percentage of total islet insulin secretion in each fraction following treatment with indicated amount of glucose or KCl is shown. (Right) Histogram showing area under the curves for perifusion GSIS data is shown, separated into first phase (8–12 min) and second phase (12–24 min) high glucose (16.7 mM) and response to depolarization (45 mM KCl). (f) Insulin secretion from S/S (n=3 mice) and SABKO (n=3 mice) islets treated with low (2.8 mM) and high (16.7 mM) glucose, and 45 mM KCl for 1 hr. All error bars represent s.d. Statistical significance for all data was determined using two-tailed unpaired Student’s t-test (* p < 0.01, ** p < 0.05). The statistics source data for (a–c and f) are provided in Supplementary Table 1.