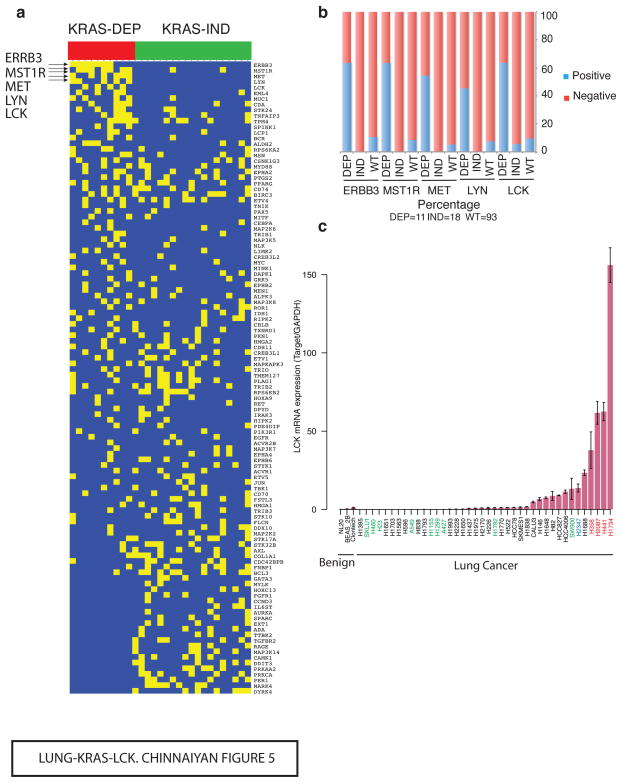
Figure 5. Outlying kinases in KRAS-Dep cell lines.
(a) Cancer outlier profile analysis (COPA) of ‘informative’ genes on an extended gene expression data set of KRAS-mutated cell lines confirms LCK, MET, LYN and ERBB3 as differentially abundant proteins in KRAS-Dep but not in KRAS-Ind cell lines. Eleven KRAS-Dep and 18 KRAS-Ind were analyzed. (b) Overexpressed LCK is present in at least 60% but in <10% of the either wild type or KRAS-Ind cell lines. MET, ERBB3, MST1R and LYN show a similar pattern. 11 KRAS-Dep, 18 KRAS-Ind and 93 KRAS-WT cell lines were analyzed. (c) LCK expression measured by QRT–PCR in a panel of KRAS-Dep (red label), KRAS-Ind (green label) and KRAS-WT (black label) cell lines confirms high levels of LCK in KRAS-Dep cell lines and none or negligible expression in KRAS-Ind or WT cell lines. Cell line H2347 (blue label) harbors NRAS Q61K mutation, but its dependency status could not be established. Bar height corresponds to the average over three independent replicates and error bars are defined as s.e.m.

