
Figure 2.
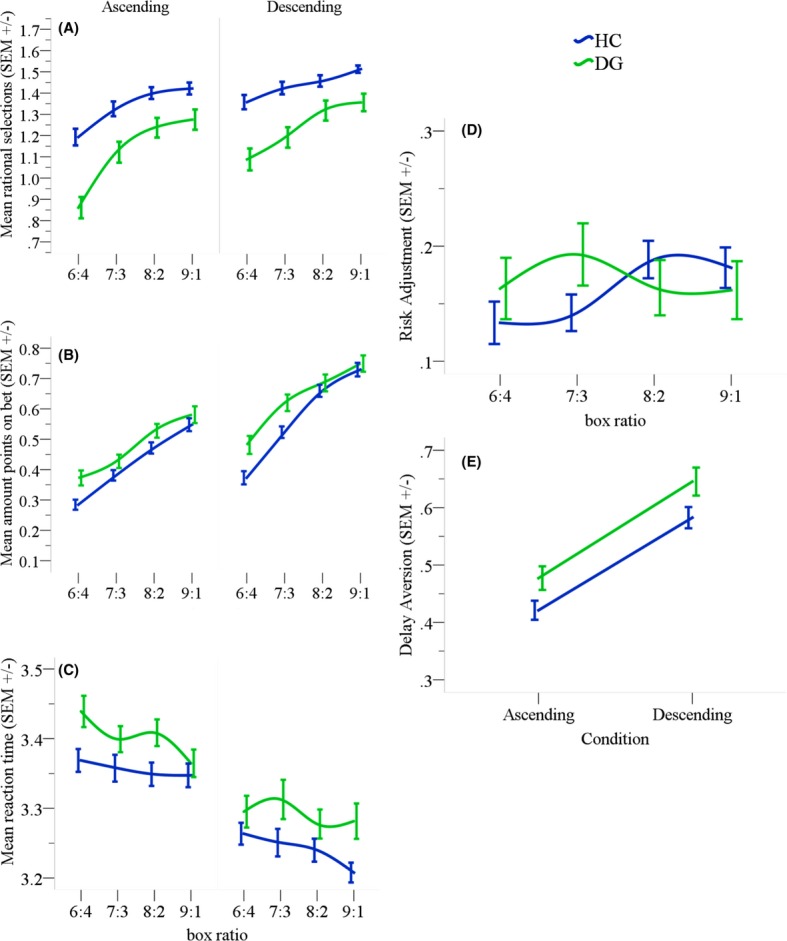
(A) Rational choices made in the task where from each box ratio the highest number chosen indicates the most likely outcome and, therefore, the right response. HCs made more rational choices than DGs. (B) Mean amount of points gambled in trials where the correct choice was made. DGs gambled more points in all box ratios compared to HCs. (C) Mean reaction times across the different box ratios for both conditions. (D) Overview of the mean number of points placed on bet across the different box ratios. HCs increased their bets relative to the increasing box ratio. DGs on the other hand placed higher bets in the early box ratios (6:4 & 7:3) and lower bets in later ratios (8:2 & 9:1). (E) Overall betting behavior for each condition separately. Both groups gambled fewer points in the ascending condition but DGs overall placed higher bets than HCs. This difference although is apparent in the graphical representation did not meet statistical significance. Error bars from the figure below represent standard error of the mean.