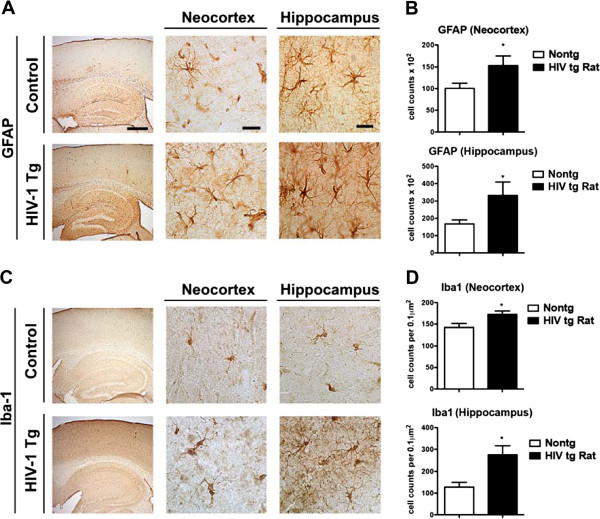
Figure 2.

Astrogliosis and microgliosis in the brain of HIV-1 Tg rats. A) Immunostaining for the astrocytic marker GFAP in HIV-1 Tg and control rats. The panel to the left is a low power view (4X) of the neocortex and hippocampus, while the panels in the middle and right are at higher magnification (400X) (B) Computer aided image analysis of the numbers of GFAP positive cells in the neocortex and hippocampus demonstrate a significant increase in astroglial cells in the HIV-1 tg rats (Student’s t-test). C) Immunostaining for the microglial marker Iba-1 in HIV-1 Tg and control rats. The panel to the left is a low power view (4X) of the neocortex and hippocampus, while the panels in the middle and right are at higher magnification (400X); D) Computer aided image analysis of the numbers of Iba-1 positive cells in the neocortex and hippocampus demonstrate a significant increase in astroglial cells in the HIV-1 Tg rats (* = p < 0.01; n = 6, by t-test). Bar = 250 and 25 μm at 4X and 400x, respectively.
