
Figure 3.
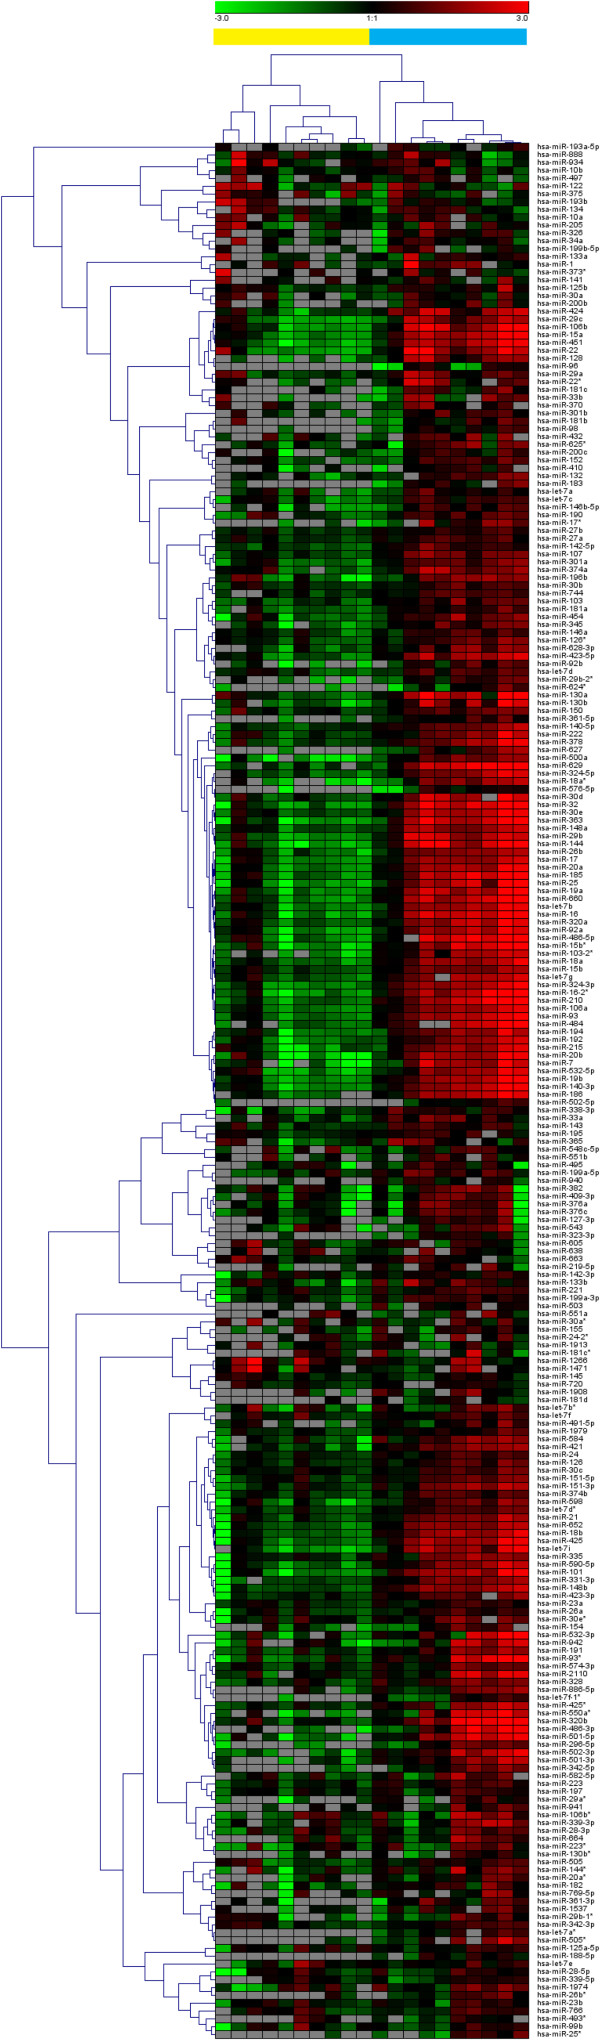
The effect of hemolysis on serum miRNA levels. An average-linkage Pearson correlation cluster analysis of the serum miRNA profiles of matched unlysed (yellow) and lysed (blue) samples collected from 10 healthy individuals. Only miRNAs detected in at least 80% of lysed samples or 80% of unlysed samples are included.