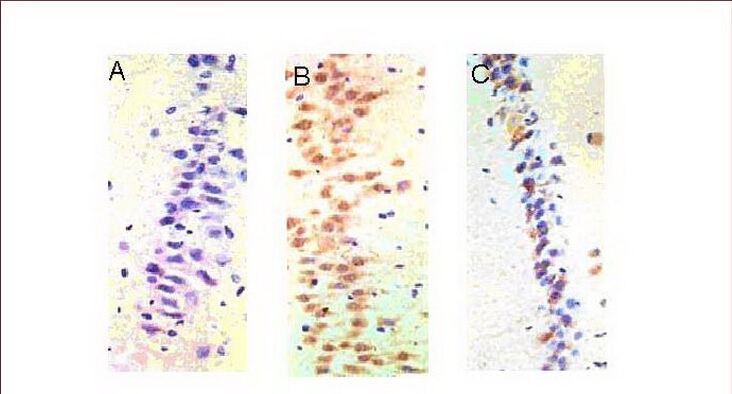
Figure 4.

Expression of Bax in the rat hippocampal CA1 region (immunohistochemical staining, light microscopy, × 400).
(A) There was almost no expression of Bax in the control group.
(B) A large amount of Bax expression (brown cells) was observed in the medium-intensity exercise group.
(C) Bax expression (brown cells) was less in the high-intensity exercise group when compared with the medium-intensity exercise group.
