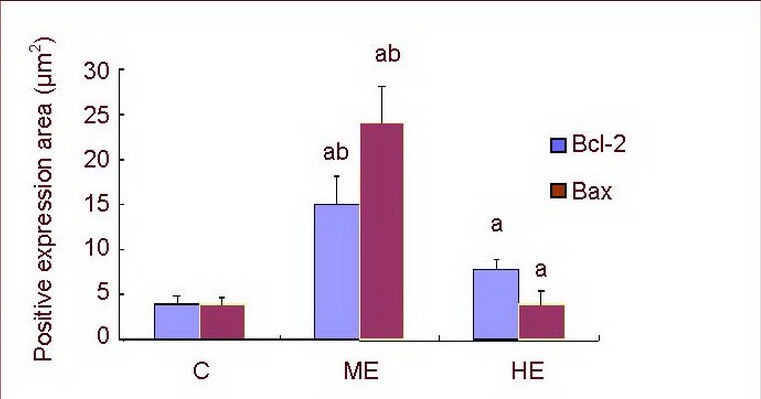
Figure 5.

Bcl-2 and Bax protein expression in the rat hippocampal CA1 region.
Data are expressed as mean ± SD of 10 rats in each group. aP < 0.01, vs. control group; bP < 0.01, vs. HE group (one-way analysis of variance followed by Tukey's test).
C: Control group; ME: medium-intensity exercise group; HE: high-intensity exercise group.
