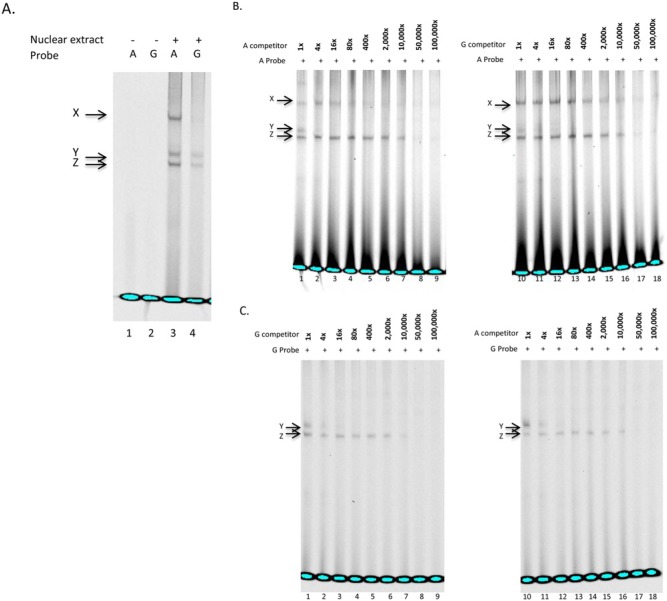
Figure 1.
Electrophoretic mobility shift assays of MMP3 rs522616. (A) Double-stranded, infrared-labeled A and G probes incubated in the absence (lanes 1, 2) or presence of cell nuclear extract (lanes 3, 4). (B) Competition assay with double-stranded, infrared labeled A probe incubated with cell nuclear extract and 1-, 4-, 16-, 80-, 400-, 2,000-, 10,000-, 50,000-, and 100,000-fold molar excess of unlabeled A (lanes 1-9) and G probes (lanes 10-18). (C) Competition assay with double-stranded, infrared-labeled G probe incubated with cell nuclear extract and 1-, 4-, 16-, 80-, 400-, 2,000-, 10,000-, 50,000-, and 100,000-fold molar excess of unlabeled G (lanes 1-9) and A probes (lanes 10-18). Note that complex Y was produced by both A and G probes and abolished by the lowest competitor DNA levels (16X) (Fig. 1C, lanes 3, 12), suggesting that the protein(s) involved bind equally to the A- or G-containing motifs. MMP3_A also produced an additional complex (X) (Fig. 1A, lane 3), which was abolished by unlabeled A-competitor (Fig. 1B, lane 5), but not G-competitor at even higher concentrations (Fig. 1B, lanes 10-18), suggesting that complex X is specific to the A probe.

