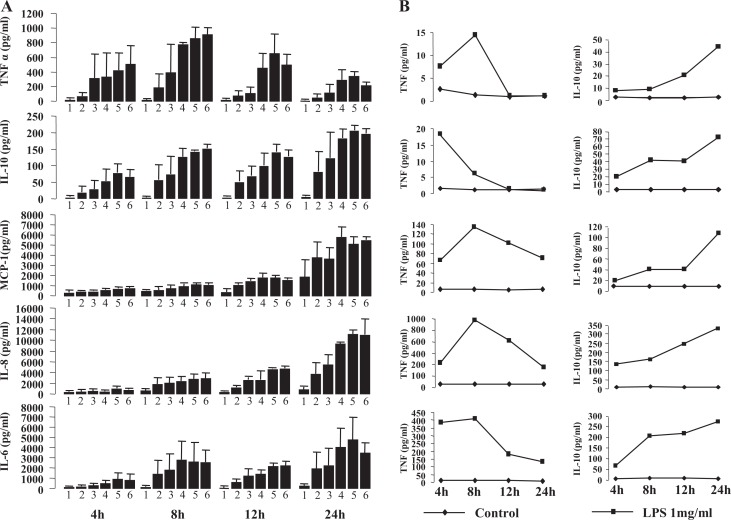
Figure 2.
Dose and time curves of tumor necrosis factor (TNF), interleukin (IL) 10, monocyte chemoattractant protein 1 (MCP-1), IL-8, and IL-6 secretion from decidual cells stimulated with lipopolysaccharide (LPS). A, Cells were treated with LPS with different dosages from 0 ng/mL (1); 0.1 ng/mL (2); 1 ng/mL (3); 10 ng/mL (4); 100 ng/mL (5); 1000 ng/mL; (6) and at different times as indicated (n = 2). Each bar represents the concentration of cytokines in medium (pg/mL); data are presented as mean ± standard error of the mean (SEM). B, Cells were treated with vehicle (control) or 1 mg/mL LPS at 4, 8, 12, and 24 hours as indicated. Results are presented as 5 individual experiments.

