
Figure 4.
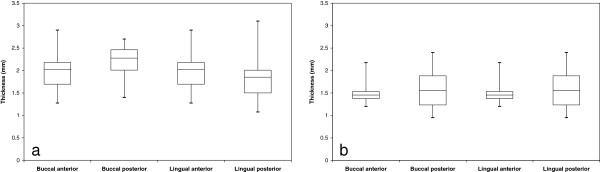
Box diagrams of cortical bone thickness for the (a) maxilla and (b) mandible. Boxes represent the 1st and 3rd quartiles, the band inside is the median and the whiskers are the minimum and maximum values of all of the data.
Official websites use .gov
A
.gov website belongs to an official
government organization in the United States.
Secure .gov websites use HTTPS
A lock (
) or https:// means you've safely
connected to the .gov website. Share sensitive
information only on official, secure websites.
Box diagrams of cortical bone thickness for the (a) maxilla and (b) mandible. Boxes represent the 1st and 3rd quartiles, the band inside is the median and the whiskers are the minimum and maximum values of all of the data.