
Figure 2.
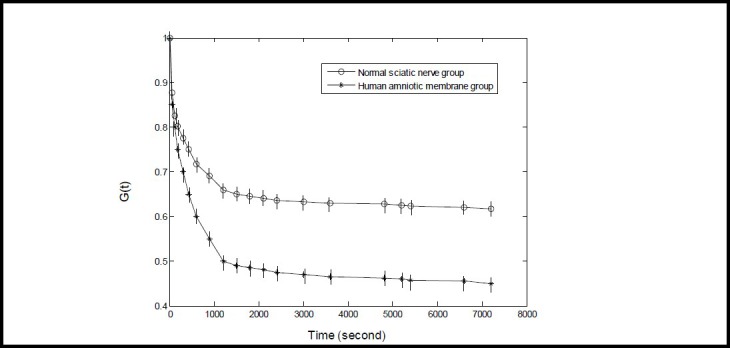
Normalized stress relaxation function curve of normal human sciatic nerve and amnion tissues.
The Y-axis G(t) represents the normalized stress relaxation function (G(t) zero dimension) and the X-axis represents time. The normalized stress relaxation function was calculated using the formula of G(t)= σ(t)/ σ(0), in which G(t) is the normalized stress relaxation function, σ(0) is the stress value at 0 second, and σ(t) is the stress value at a given time point. The normalized stress relaxation function value at 0 second was defined as 1. Data are expressed as mean ± SD, n = 15. The 7 200 second stress relaxation function value decreased to a greater extent in the amniotic membrane group compared with the sciatic nerve group (P < 0.05; paired t-test).