
Figure 3.
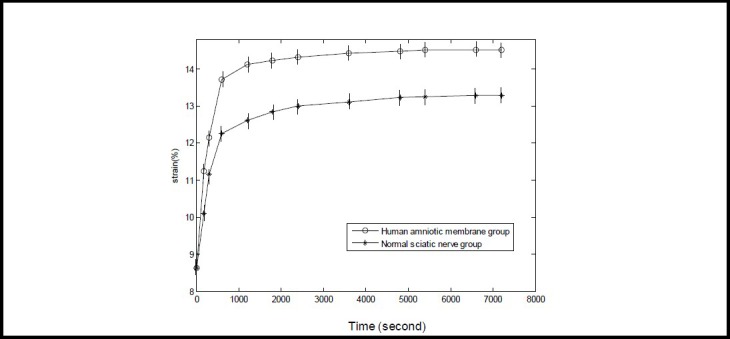
Creep curve of normal sciatic nerve and human amniotic membrane specimens.
The Y-axis represents strain (%; zero dimension) calculated from the experimental data by computer fitting, and the X-axis represents time. Data are expressed as mean ± SD, n = 15.
The 7 200-second strain of normal sciatic nerve and amniotic membrane groups increased by 4.66% and 5.88%, respectively, when compared with 0 second (P < 0.05; one-way analysis of variance and Sceffe method). The 7 200-second strain increase value was greater in the human amniotic membrane group compared with the sciatic nerve group (P < 0.05; paired t-test).