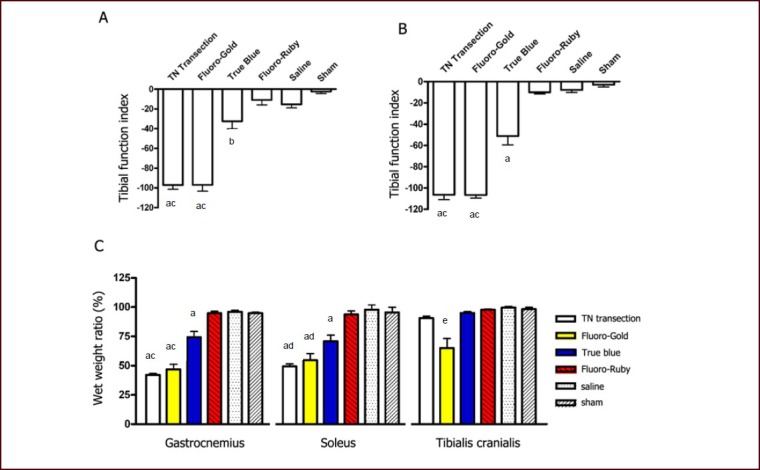
Figure 3.

Motor impairment and muscle atrophy in response to tracer injection into the tibial nerve.
(A, B) Bar charts showing tibial function index at 3 and 14 days after tracer injection. No statistical significance was found among Fluoro-Gold, saline and sham surgery groups, nor between Fluoro-Gold and tibial nerve transection groups.
(C) Bar chart showing wet weight ratio (experimental side/contralateral normal side) for gastrocnemius, soleus and tibialis cranialis muscles at 14 days after tracer injection. The wet weight ratio of the tibialis cranialis muscle in the Fluoro-Gold group was significantly lower than any other group. The True Blue group showed less severe atrophy in the gastrocnemius and soleus muscles compared with the Fluoro-Gold group.
Data were expressed as mean ± SEM (n = 10), and one-way analysis of variance with Student-Newman-Keuls post hoc test was used for data analysis. aP < 0.001, bP < 0.05, vs. Fluoro-Ruby, saline and sham surgery groups (A–C). cP < 0.001, dP < 0.01, vs. True Blue group (A–C). eP < 0.001, vs. any of the other groups (C).
TN: Tibial nerve; sham: sham surgery.
