Figure 4.

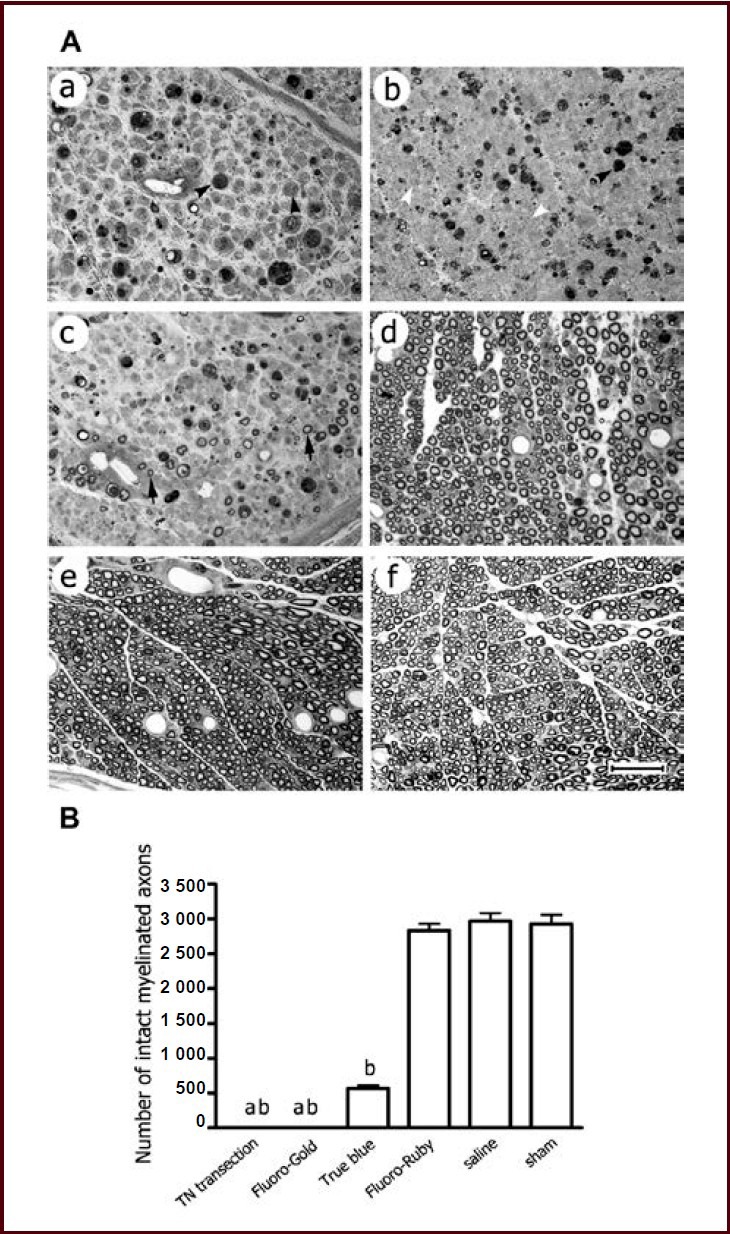
Degeneration of myelinated nerve fibers within the tibial nerve distal to the site of tracer injection at 14 days after tracer injection.
(A) Representative photomicrographs showing semi-thin transverse section of the tibial nerve stained with toluidine blue. The tibial nerve transection, Fluoro-Gold, True Blue, Fluoro-Ruby, saline and sham surgery (sham) groups (a–f) are shown alphabetically. Nearly all the myelinated nerve fibers were seen to be degenerated in the Fluoro-Gold group (b), the majority in the True Blue group (c), but very few in the Fluoro-Ruby and saline groups (d, e). The profiles of individual myelinated nerve fibers seemed obscure in the Fluoro-Gold group, which was in contrast to the tibial nerve transection group where profiles of degenerating fibers remained clear (a). Scale bar: 50 μm.
(B) Bar graph showing counts of intact myelinated axons. Data were expressed as mean ± SEM, and one-way analysis of variance with Student-Newman-Keuls post hoc test was used for data analysis (n = 5). aP < 0.01, vs. True Blue group; bP < 0.001, vs. Fluoro-Ruby, saline and sham groups. TN: Tibial nerve.
