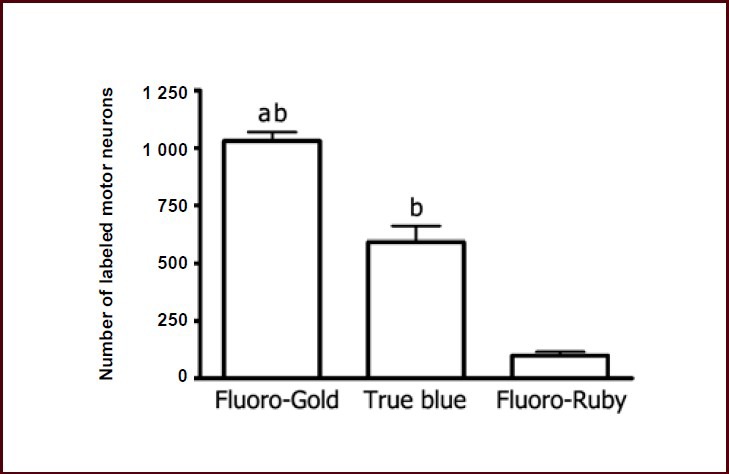
Figure 5.

Number of labeled motor neurons in the ventral horn of the spinal cord at 14 days after tracer injection.
Data were expressed as mean ± SEM, and one-way analysis of variance with Student-Newman-Keuls post hoc test was used for data analysis (n = 5). aP < 0.001, vs. True Blue group; bP < 0.001, vs. Fluoro-Ruby group.
