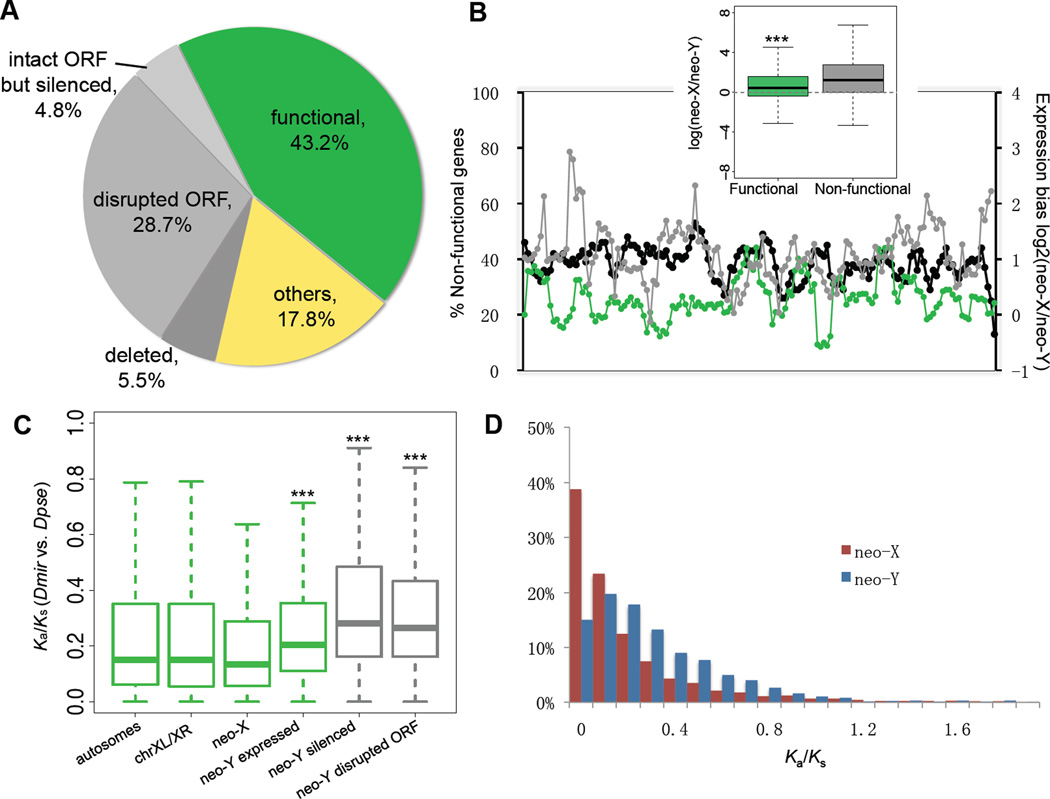
Figure 2.
(A) Composition of neo-Y genes with regards to inferred functionality (green: intact ORFs and detectable expression in adult male; grey: disrupted ORF and/or silenced expression; yellow: genes without neo-X expression or without diagnostic SNPs). (B) The chromosomal distribution of non-functional genes across a sliding window size of 20 genes (black line). Average neo-X expression bias within the investigated window was calculated from log ratios of neo-X vs. neo-Y expression for functional (green) and non-functional (grey) genes. Functional neo-Y genes show significantly less neo-X biased expression than non-functional genes (boxplot, P<2.2e-16, Wilcoxon test). (C) Evolutionary rate comparisons (Ka/Ks ratios relative to D. pseudoobscura) among genes on different chromosomes. Wilcoxon tests show significant differences in Ka/Ks ratios between neo-X vs. neo-Y genes, genes with intact neo-Y copies with vs. without expression (P=0.000242) and disrupted vs. intact transcribed neo-Y genes (P=2.971e-12). Different levels of significance are marked as asterisks. (D) The frequency distribution of Ka/Ks ratios of neo-X and neo-Y genes.

