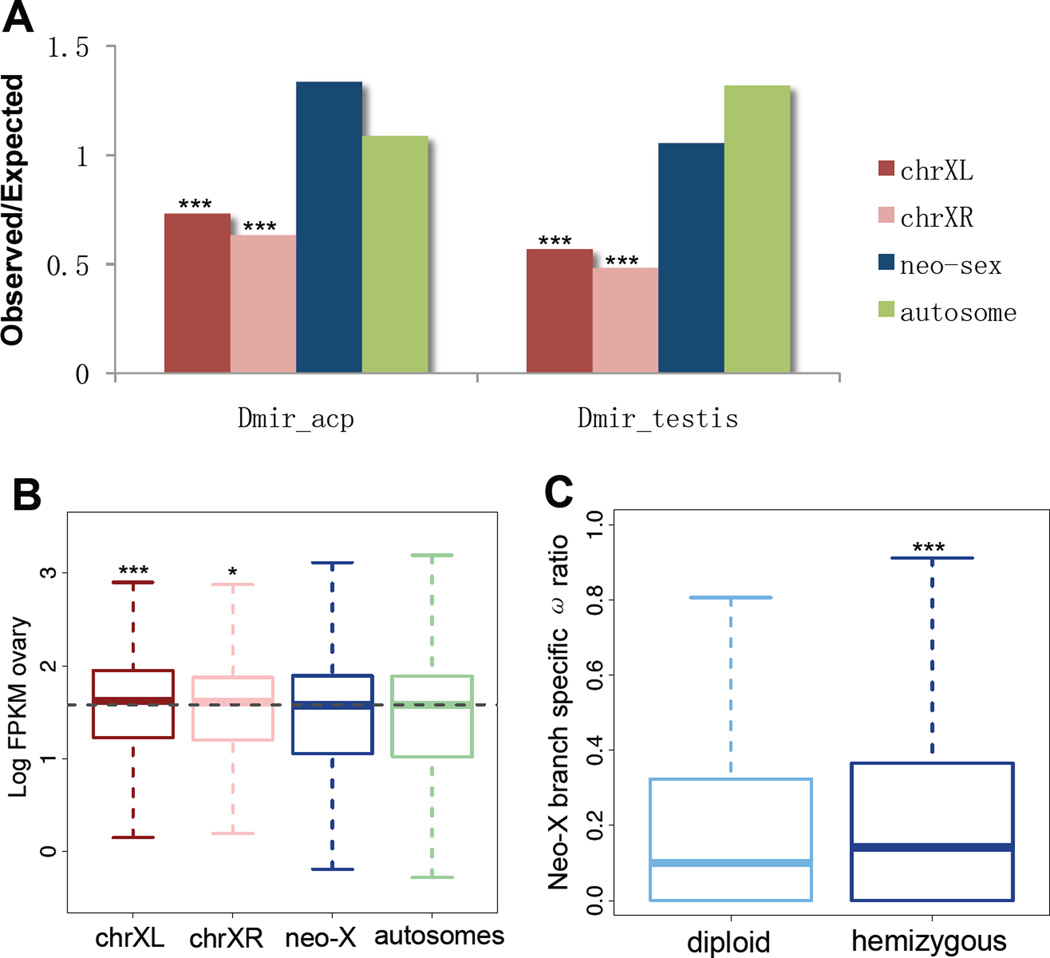
Figure 4.
(A) The observed/expected ratio of genes highly expressed (top 500; for different cutoffs see fig. S7) in testis or accessory glands. (B) Log-based absolute expression levels (FPKM) from ovary for each chromosome (see also fig. S7). (C) The ω ratio on the neo-X branch at hemizygous and diploid neo-X genes.

