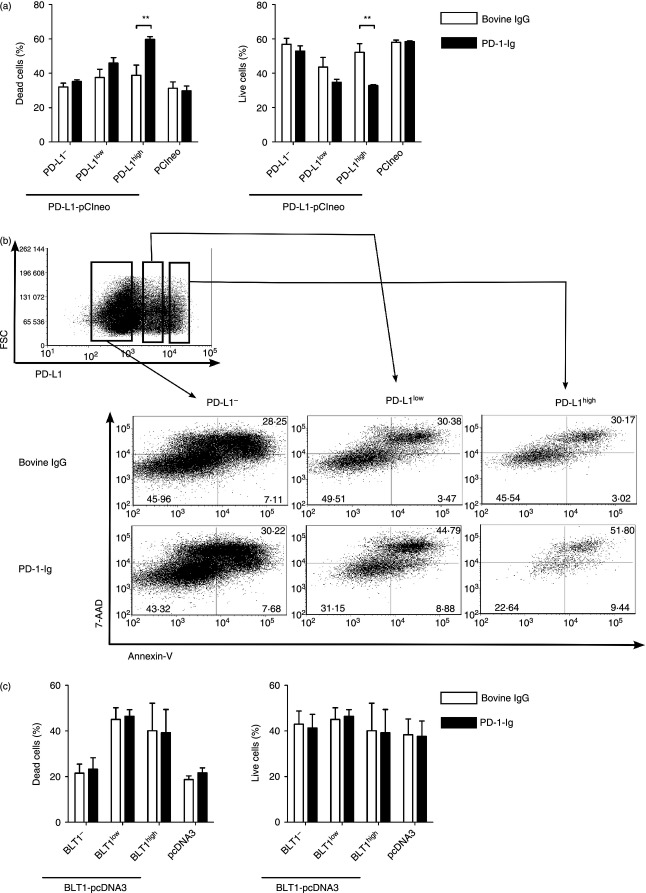
Figure 4.
Cell death in programmed death ligand 1 (PD-L1) -expressing cells treated with programmed death 1–immunoglobulin (PD-1-Ig). (a, c) Percentages of dead cells (Annexin-V+ 7-AAD+) and live cells (Annexin-V− 7-AAD−) among Cos-7 cells transfected with pCIneo encoding PD-L1 (a) or pcDNA3 encoding BLT1 (c) and treated with bovine IgG or PD-1-Ig (50 μg/ml). pCIneo or pcDNA3 was used as transfection control. PD-L1−/low/high cells were distinguished by staining with anti-PD-L1 monoclonal antibody. (b) Gating strategy and representative dot plots of PD-L1-expressing Cos-7 cells stained with Annexin-V and 7-AAD. Values in the quadrant indicate the percentage of the cells. Mean values ± SEM from three independent experiments are shown. Statistical comparisons between bovine IgG and PD-1-Ig were made using the two-way analysis of variance. Differences were considered statistically significant at P < 0·05 (**P < 0·01).

