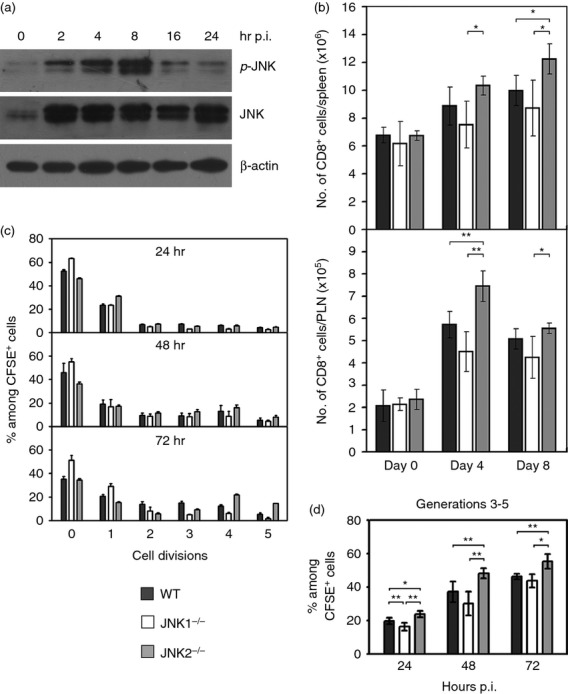
Figure 2.

Expansion of CD8+ T cells in c-Jun N-terminal kinase (JNK) -deficient mice after acute ectromelia virus (ECTV) infection. (a) JNK was activated in CD8+ T cells. CD8+ cells were isolated from popliteal lymph nodes (PLN) of virus-infected mice by positive-selection using MACS beads at the indicated time points post-infection (p.i.), and Western blot was performed for phospho-JNK and pan-JNK. Results shown are representative of more than five independent experiments. (b) Compartments of T cells in JNK-deficient mice after acute ECTV infection. JNK1−/−, JNK2−/− and wild-type (WT) mice were infected subcutaneously with ECTV. On day 0, 4 or 8 p.i., spleens and PLN were harvested from groups of five mice for each strain, and T cells were analysed by FACS. Total number of CD8+ T cells in the spleens and PLN are shown. Data represent average value of each group and are representative of three independent experiments. (c, d) Proliferation of CD8+ T cells in JNK-deficient mice after acute ECTV infection. CD8+ cells were isolated from the spleens of uninfected B6.OT-1, JNK1−/−OT-1 or JNK2−/−OT-1 mice. Cells were labelled with CFSE, and 1 × 10⁶ cells were transferred into naive WT, JNK1−/− or JNK2−/− recipients, respectively, followed by intravenous infection with ECTV-OVA. At 24, 48 or 72 hr p.i., spleens were harvested from groups of three recipient mice for each strain. Splenocytes from each recipient were analysed by FACS, and CFSE intensity was used to determine cell proliferation. (c) Mean percentage of each generation (among CD8+ CFSE+ cells). 0, parent generation; 1–5, daughter generations. (d) Summary histograms of CD8+ T-cell proliferation. Only generation 3 and later were considered as specific proliferation cells. Data are representative of two independent experiments with similar results. Results in (b–d) are expressed as mean ± SEM. *P < 0·05; **P < 0·01, Mann–Whitney U-test.
