
Figure 4.
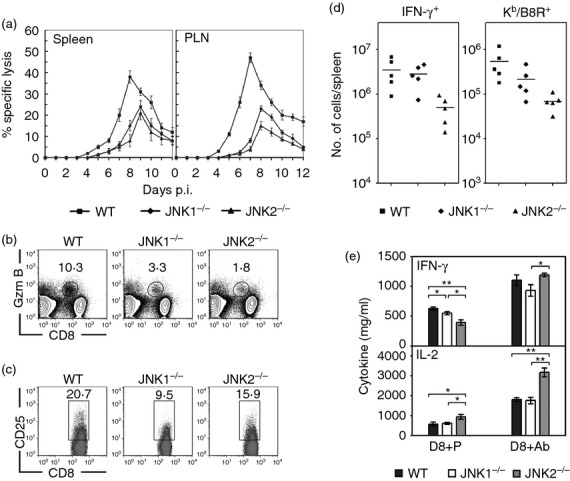
Activation and effector functions of CD8+ T cells in c-Jun N-terminal kinase (JNK) -deficient mice during ectromelia virus (ECTV) infection. (a) JNK1−/−, JNK2−/− and wild-type (WT) mice were infected subcutaneously (s.c.) with ECTV. Virus-specific cytotoxic T lymphocyte (CTL) responses in the spleens and popliteal lymph nodes (PLN) were measured at the indicated time-points. Results are expressed as mean ± SEM of lysis values from five individual mice for each group at an effector : target ratio of 33 : 1. The results are representative of two independent experiments. (b–d) JNK1−/−, JNK2−/− and WT mice (n = 5 per group) were infected s.c. with ECTV. On day 8 p.i., the activation of CD8+ T cells was determined by staining splenocytes with anti-CD8 plus indicated antibodies. The dot plots are gated on total spleen cells (b) or CD8+ T cells (c), and the numbers are the percentages of Granzyme B (Gzm B)- or CD25-positive cells among CD8+ T cells. Data represent average value of each group and are representative of three independent experiments. The symbols in (d) show the total number of specific CD8+ T cells in spleens. Each symbol represents an individual mouse and bars represent the means. (e) Purified CD8+ T cells (1 × 10⁶ cells) from the spleens of mice in (b) were either co-cultured with B8R peptide-pulsed syngeneic dendritic cells for 6 hr (D8 + P) or stimulated with anti-CD3 plus anti-CD28 for 24 hr (D8 + Ab). Cytokines in the supernatants were measured by ELISA. Results are expressed as mean ± SEM (n = 5 per group) and are representative of three independent experiments. *P < 0·05; **P < 0·01, Mann–Whitney U-test.