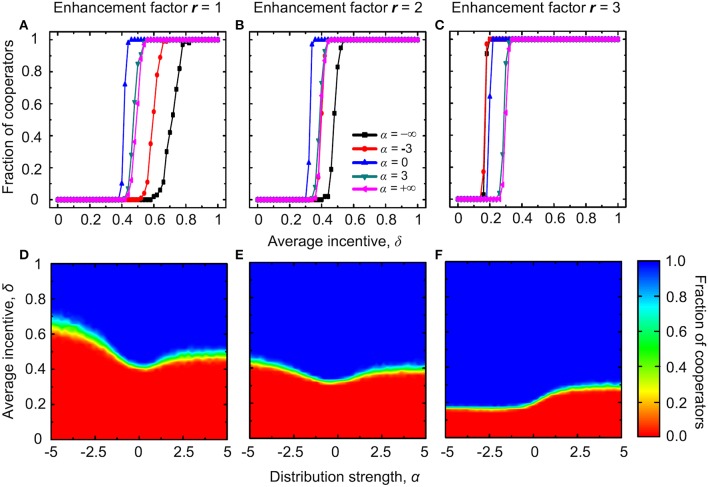
Figure 8.
Evolution of cooperation with institutional punishment and degree-normalized payoffs. Top row depicts the stationary fraction of cooperators as a function of the average amount of available incentives δ for different values of the distribution strength α. The enhancement factor is r = 1 in (A), r = 2 in (B), and r = 3 in (C). Bottom row depicts the contour plot of the fraction of cooperators as a function of α and δ, as obtained for the enhancement factor r = 1 in (D), r = 2 in (E), and r = 3 in (F).

