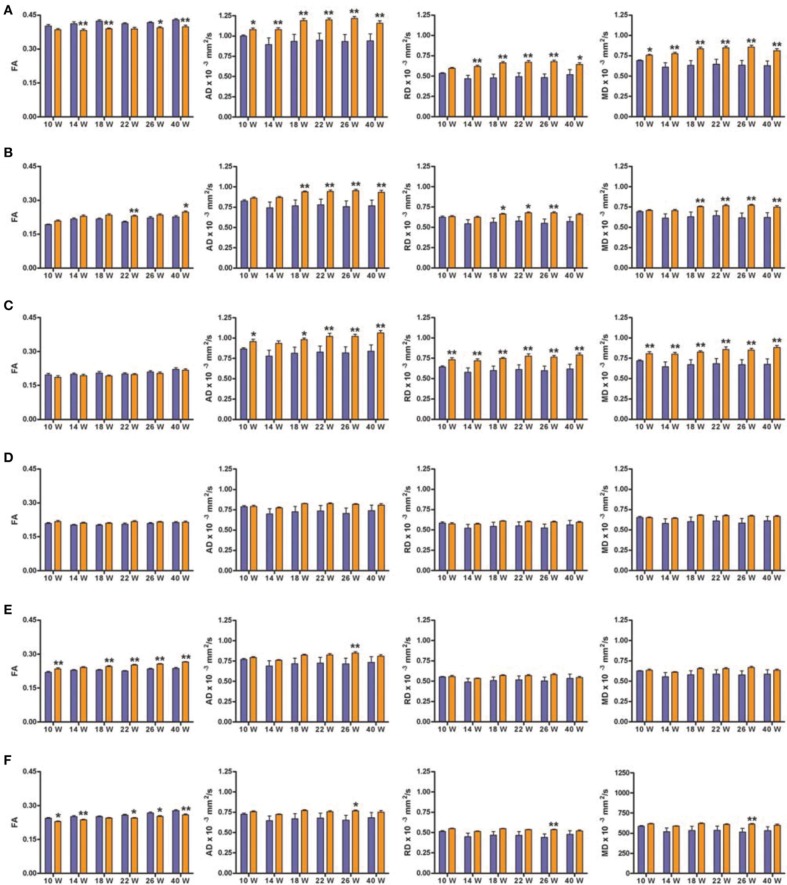
Figure 4.
DTI scalar map analysis. The four indices FA, AD, RD, and MD are indicated for each of the six structures analyzed at each of the six scanning time points. Blue bars represents control animals (n = 11) and orange bars SHR group (n = 12). (A) Corpus Callosum, (B) medial Prefrontal Cortex, (C) Hippocampus antero-dorsal, (D) Orbitofrontal Cortex, (E) Striatum, (F) Nucleus Accumbens. Data is represented as mean ± s.e.m. Asterisks indicate differences between groups (Bonferroni test) *P < 0.05, **P < 0.01.

